
When I was working with different customers implementing CPQ (configure-price-quote) tooling, one question that frequently popped up was - “OK, great. We have the quote with all the pieces, but can you now turn that spec into a graphical solution diagram?”
Think about network diagram outlining enterprise WAN (wide-area network) solution with data centres, branch connections and cloud outbreaks. Or AS-IS → TO-BE systems integration diagram accompanying implementation project description and scope.
When answering RFPs or preparing bespoke proposals - drawing these diagrams is typically busy, busy work and involves at least a few hours of skilled, technical pre-sales resource work.
So back at that time, automating this part was challenging. OK - there were maybe a few “industrial-focused” tools that could visualise for example bespoke machine design, but nothing stood out in diagramming space.
So as part of my recent tech deep-dive I decided to research whether mighty-shiny “AI” is capable of drawing solution diagrams reliably?
This post describes a little experiment that I run to find out.
Test Cases
First - let’s set the scene. To find out whether AI can draw solution diagrams (reliably), I decided to run a series of experiments, and for those - I used the two examples as described below.
1. Network Diagram
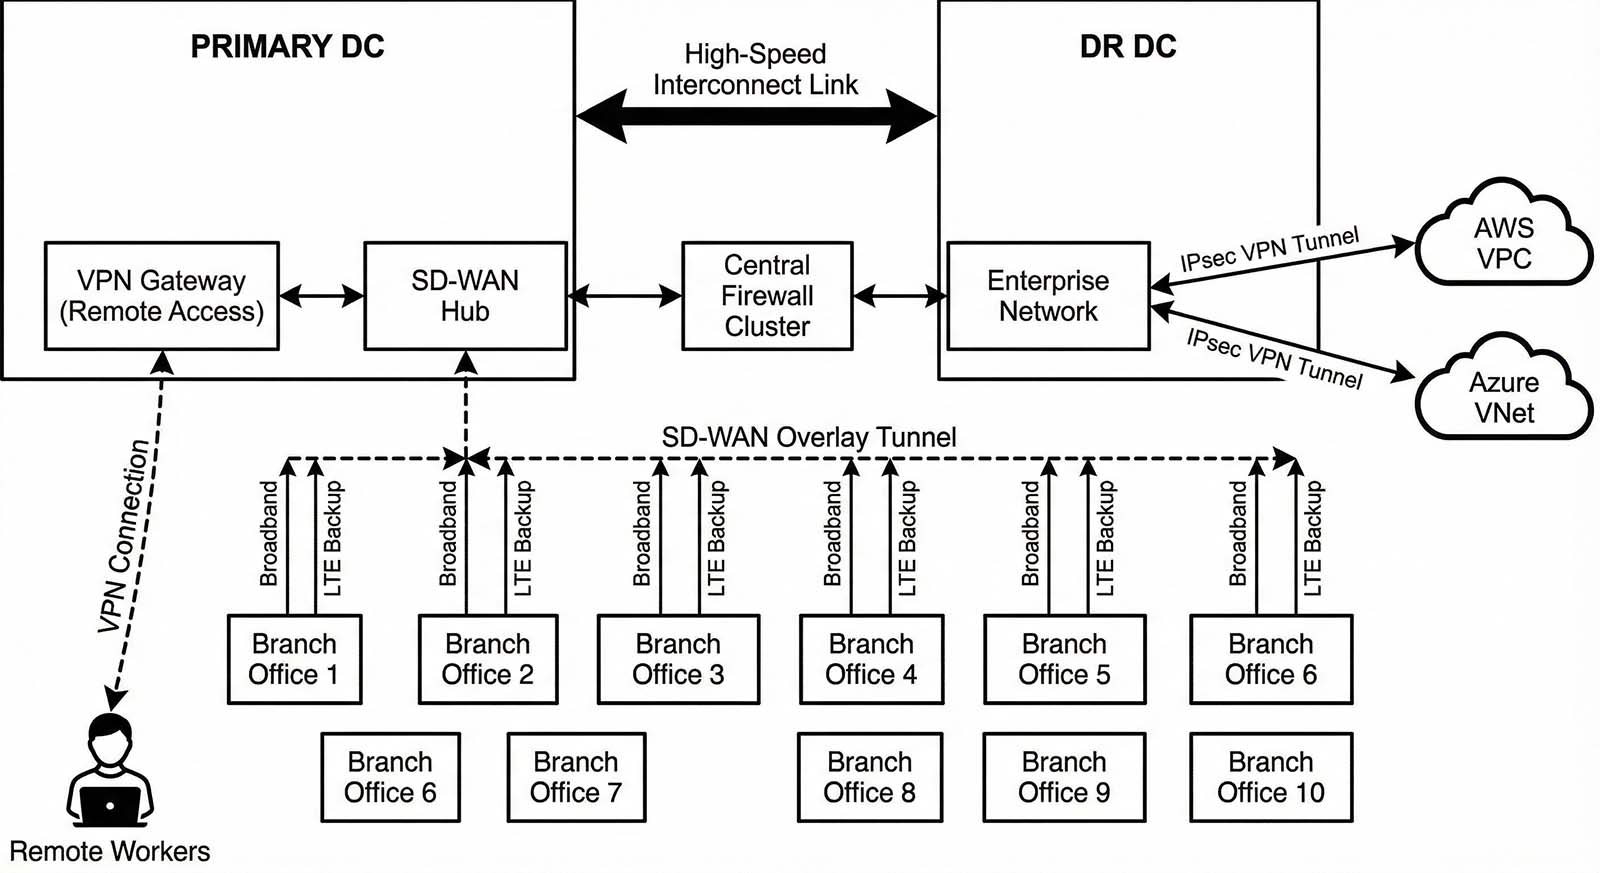
A mid-size enterprise operates a hybrid WAN connecting two data centres, ten branch offices, and cloud workloads running in AWS and Azure.
The current proposal involves:
-
Two on-prem data centres (Primary DC, DR DC)
-
Branches connected via SD-WAN overlays
-
Dedicated internet access in each branch for breakout
-
IPsec tunnels to AWS and Azure for cloud-hosted applications
-
A central firewall cluster
-
A secure VPN hub for remote users
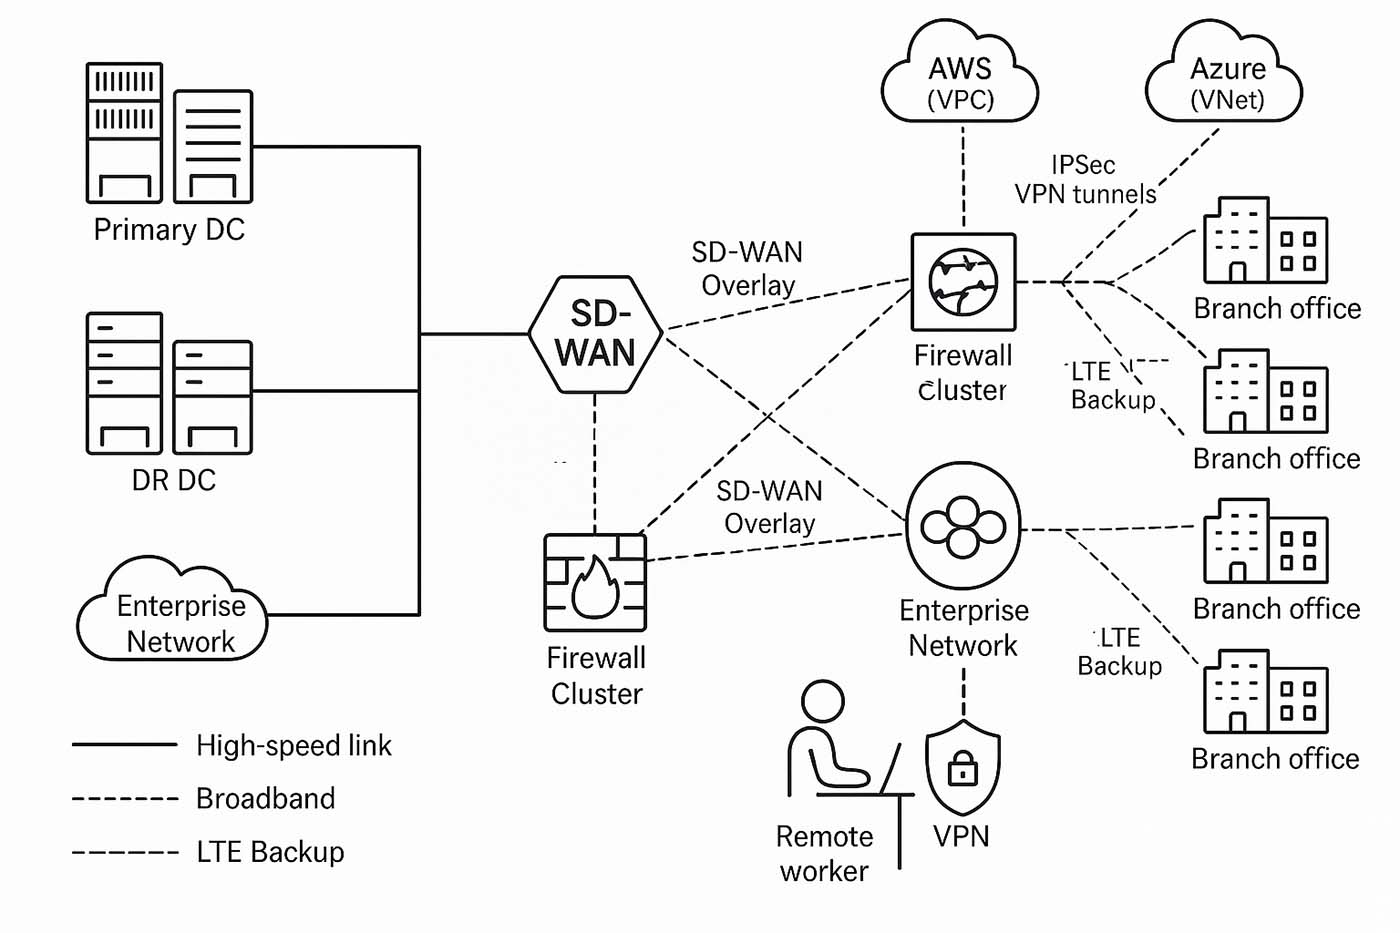
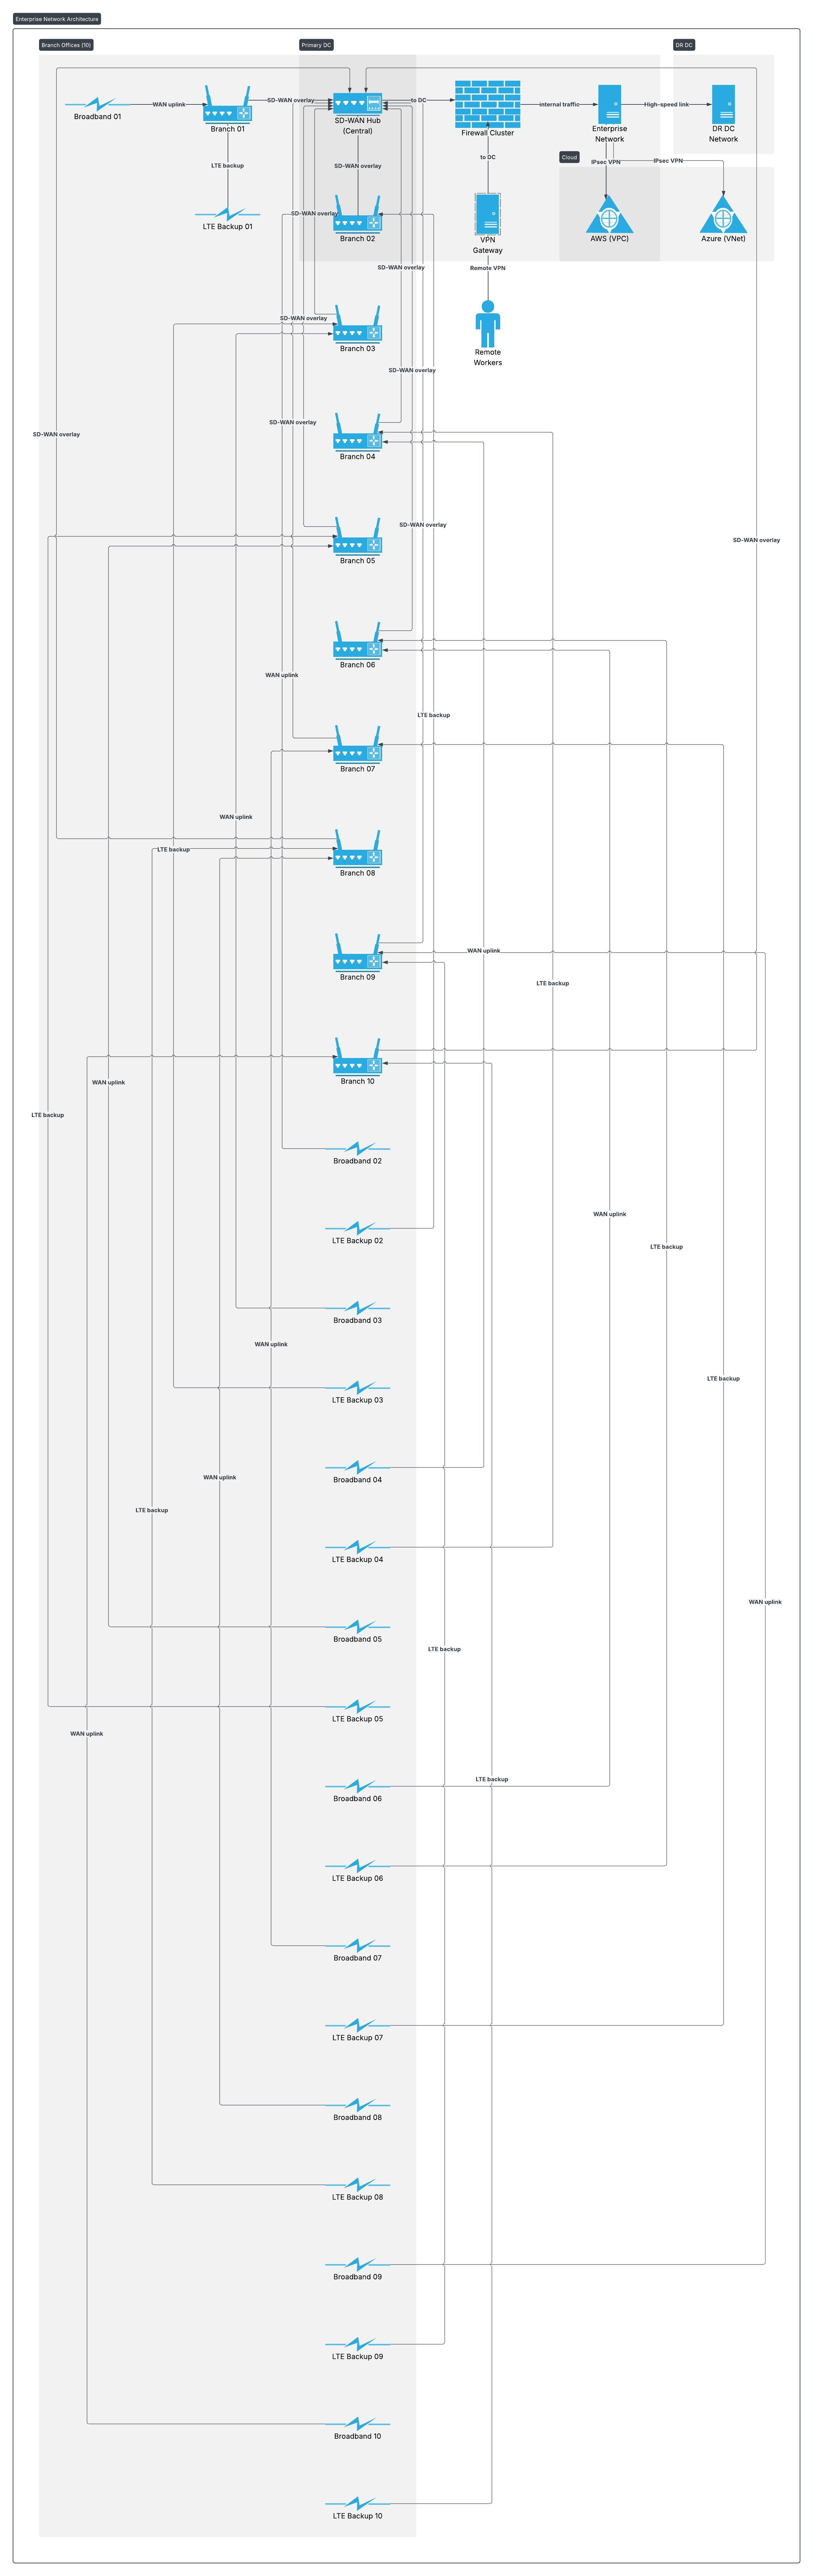
A human-drawn diagram for this would look something like below (although please excuse me if it’s not 100% correct - I’m not a pro network architect)
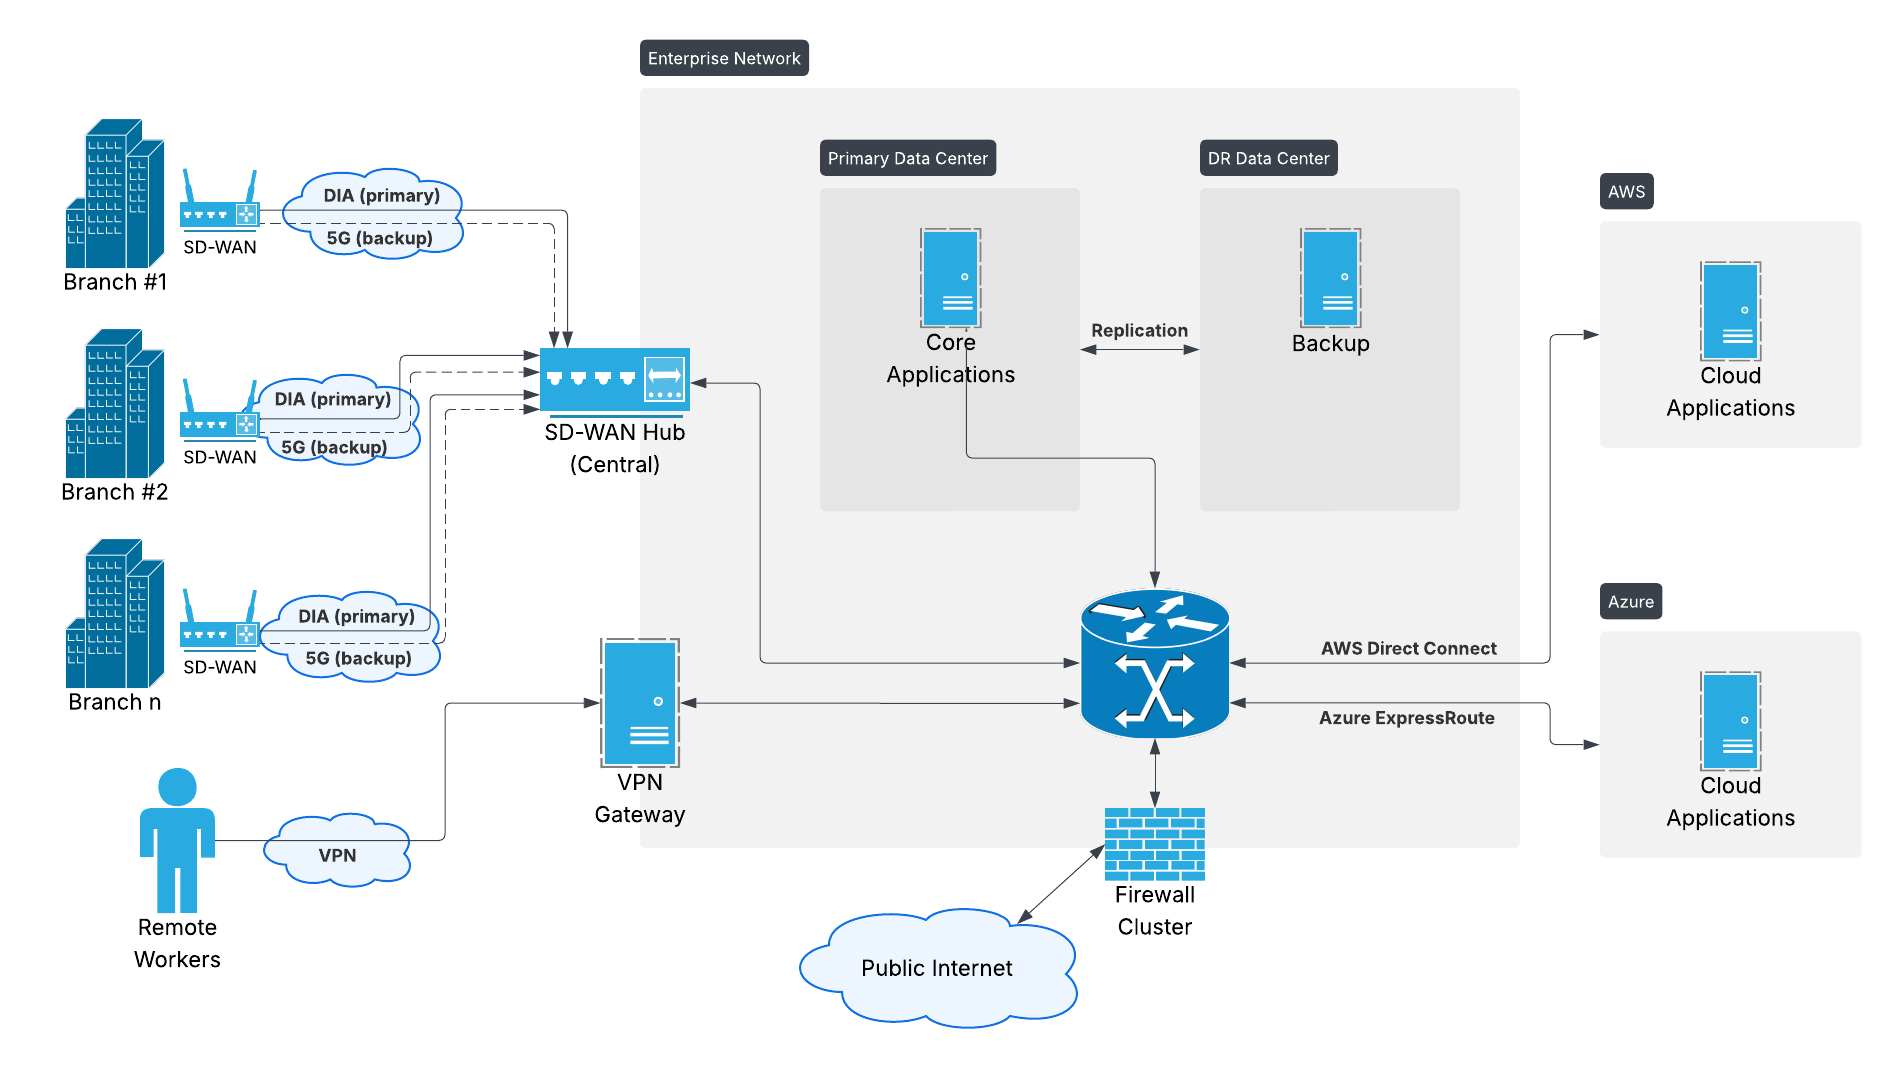
Enterprise WAN diagram drawn by a mediocre (but human) network solution architect.
2. AS-IS → TO-BE Systems Integration Diagram
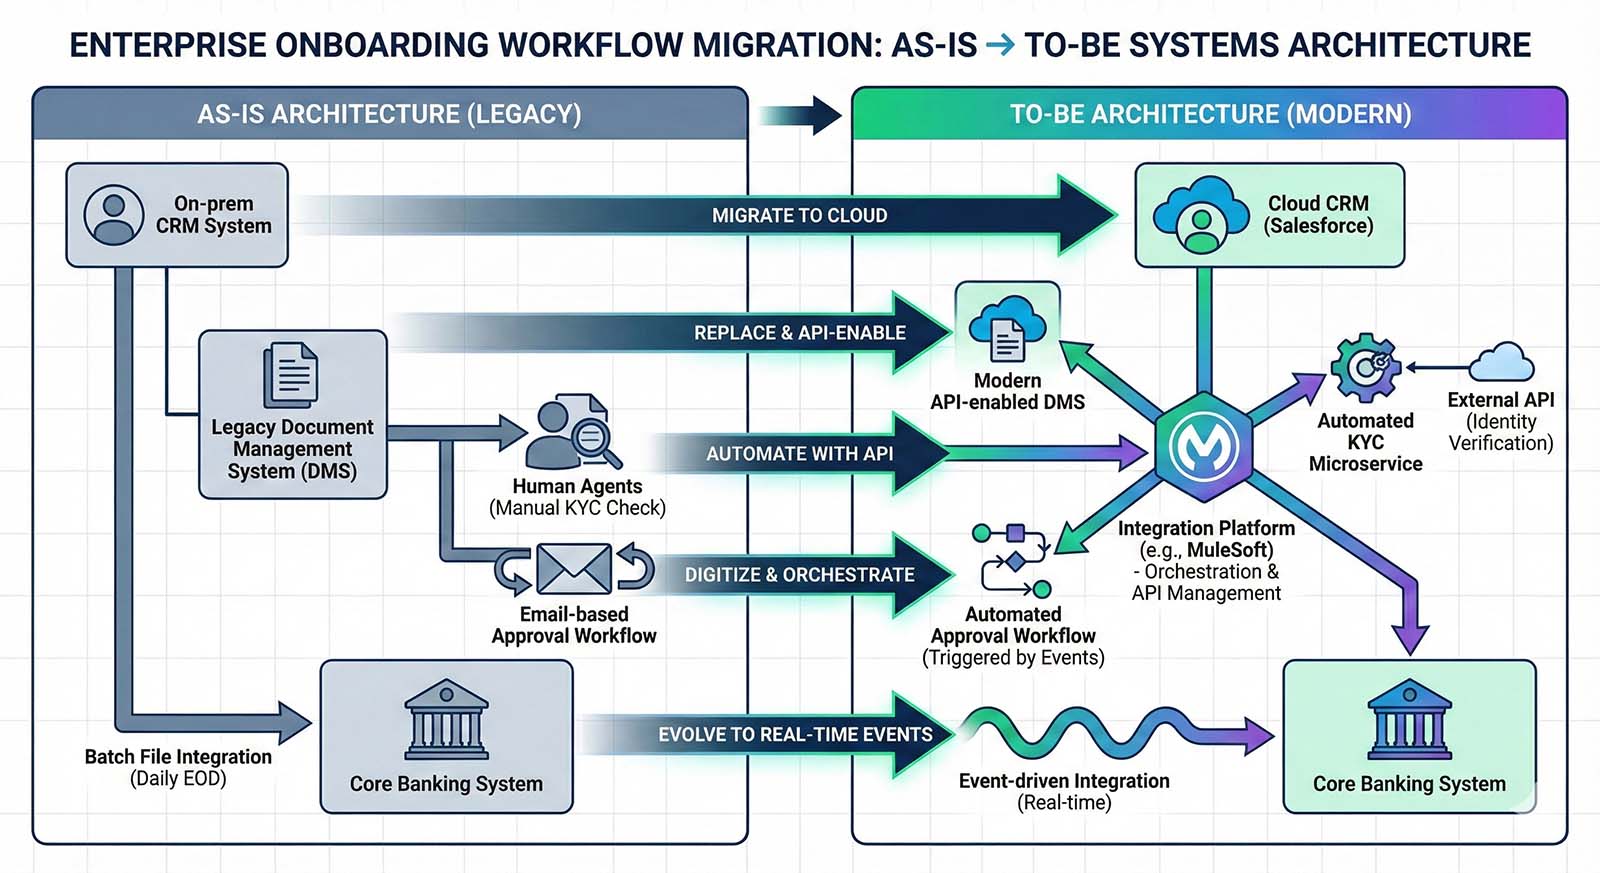
A financial services organisation is modernising its customer onboarding workflow.
AS-IS state:
-
CRM system (on-prem)
-
Legacy Document Management System (DMS)
-
Manual KYC check performed by agents
-
Batch integration to Core Banking System
-
Email-based approval workflow
TO-BE state:
-
Salesforce CRM (cloud)
-
Modern DMS with API integration
-
Automated KYC service (3rd-party API)
-
Event-driven integration to Core Banking
-
Orchestration via an Integration Platform (MuleSoft / Boomi / WSO2)
-
Automated approval flow triggered by onboarding events
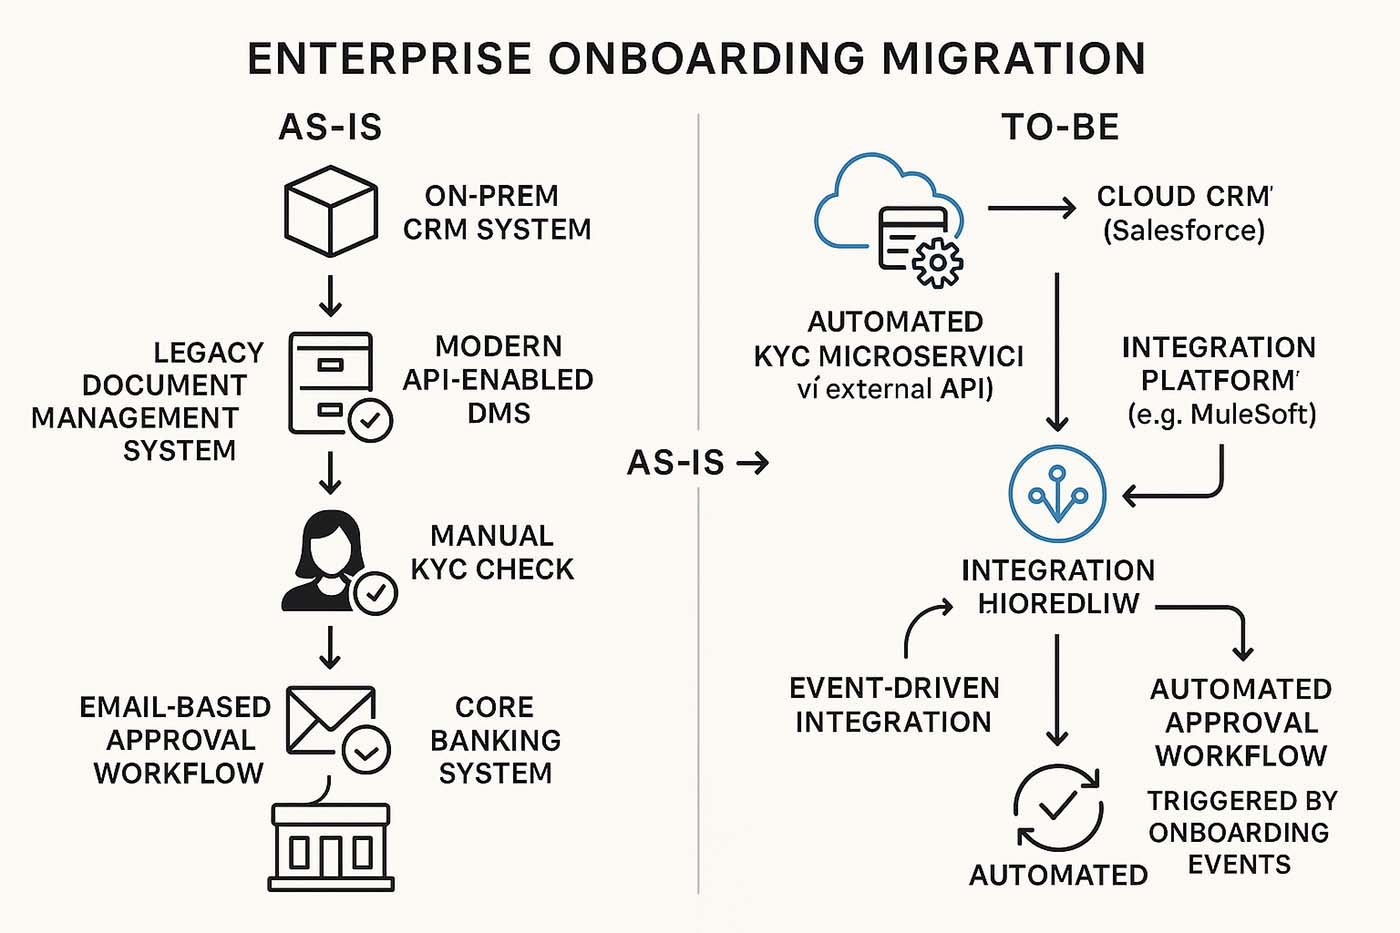
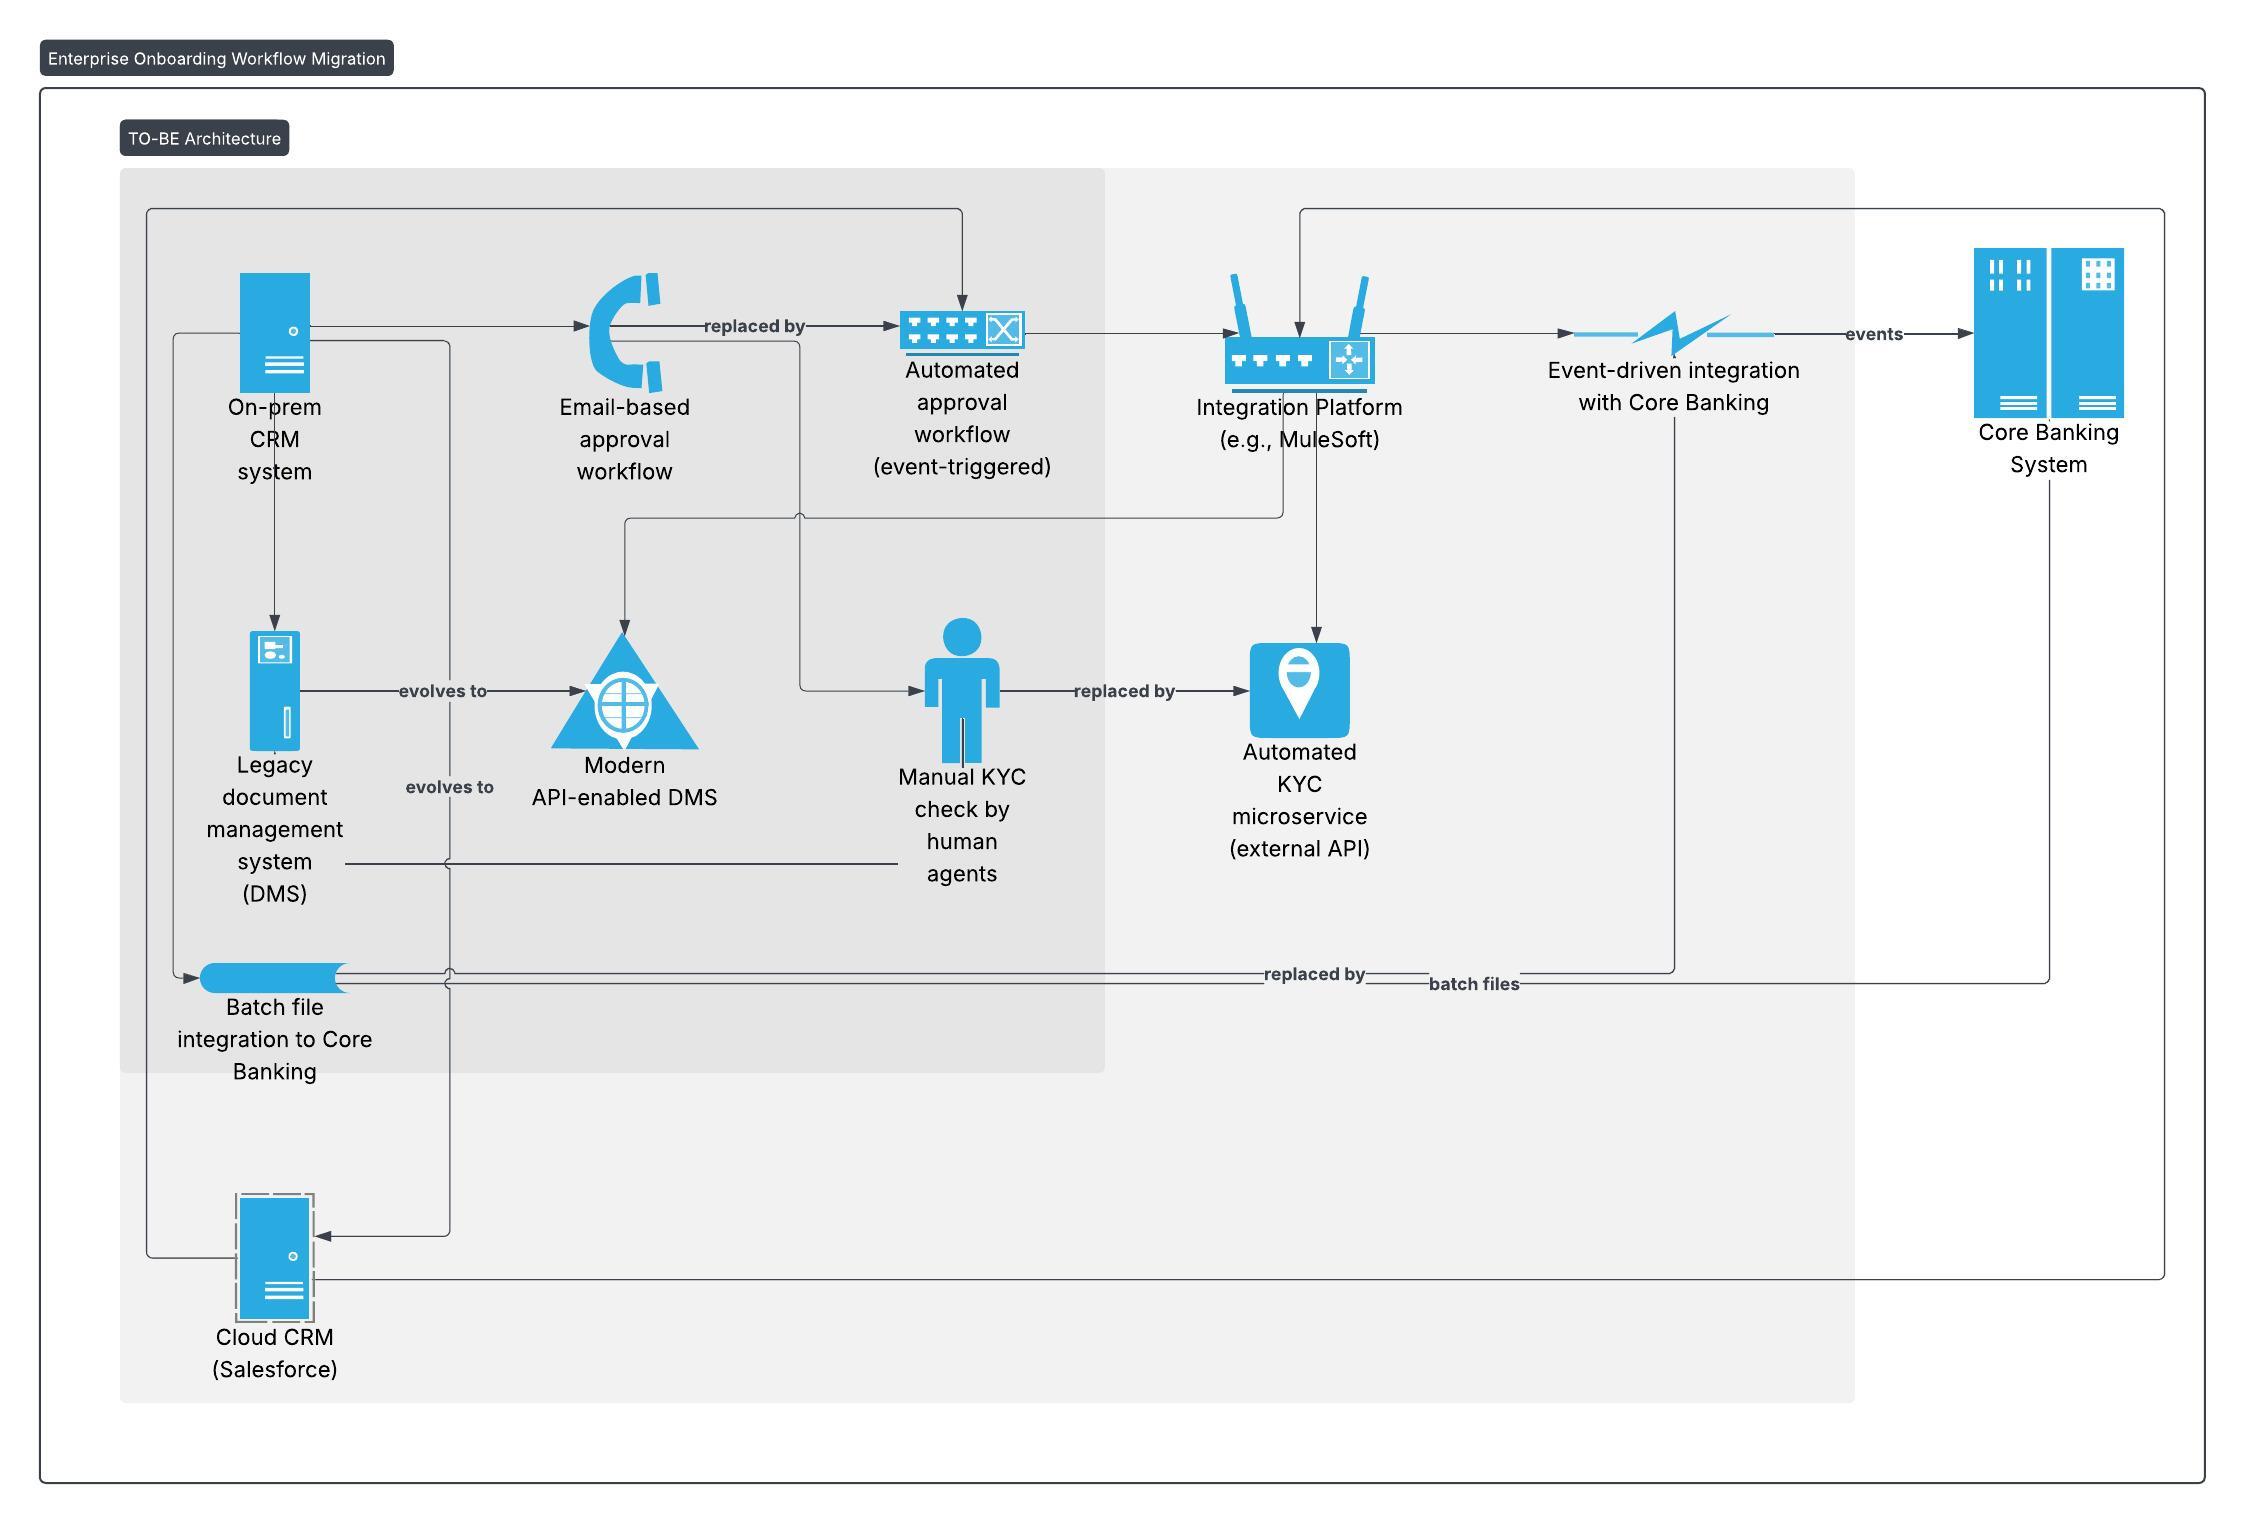
Again, to set some benchmark, a human-drawn diagram for this would look something like below:
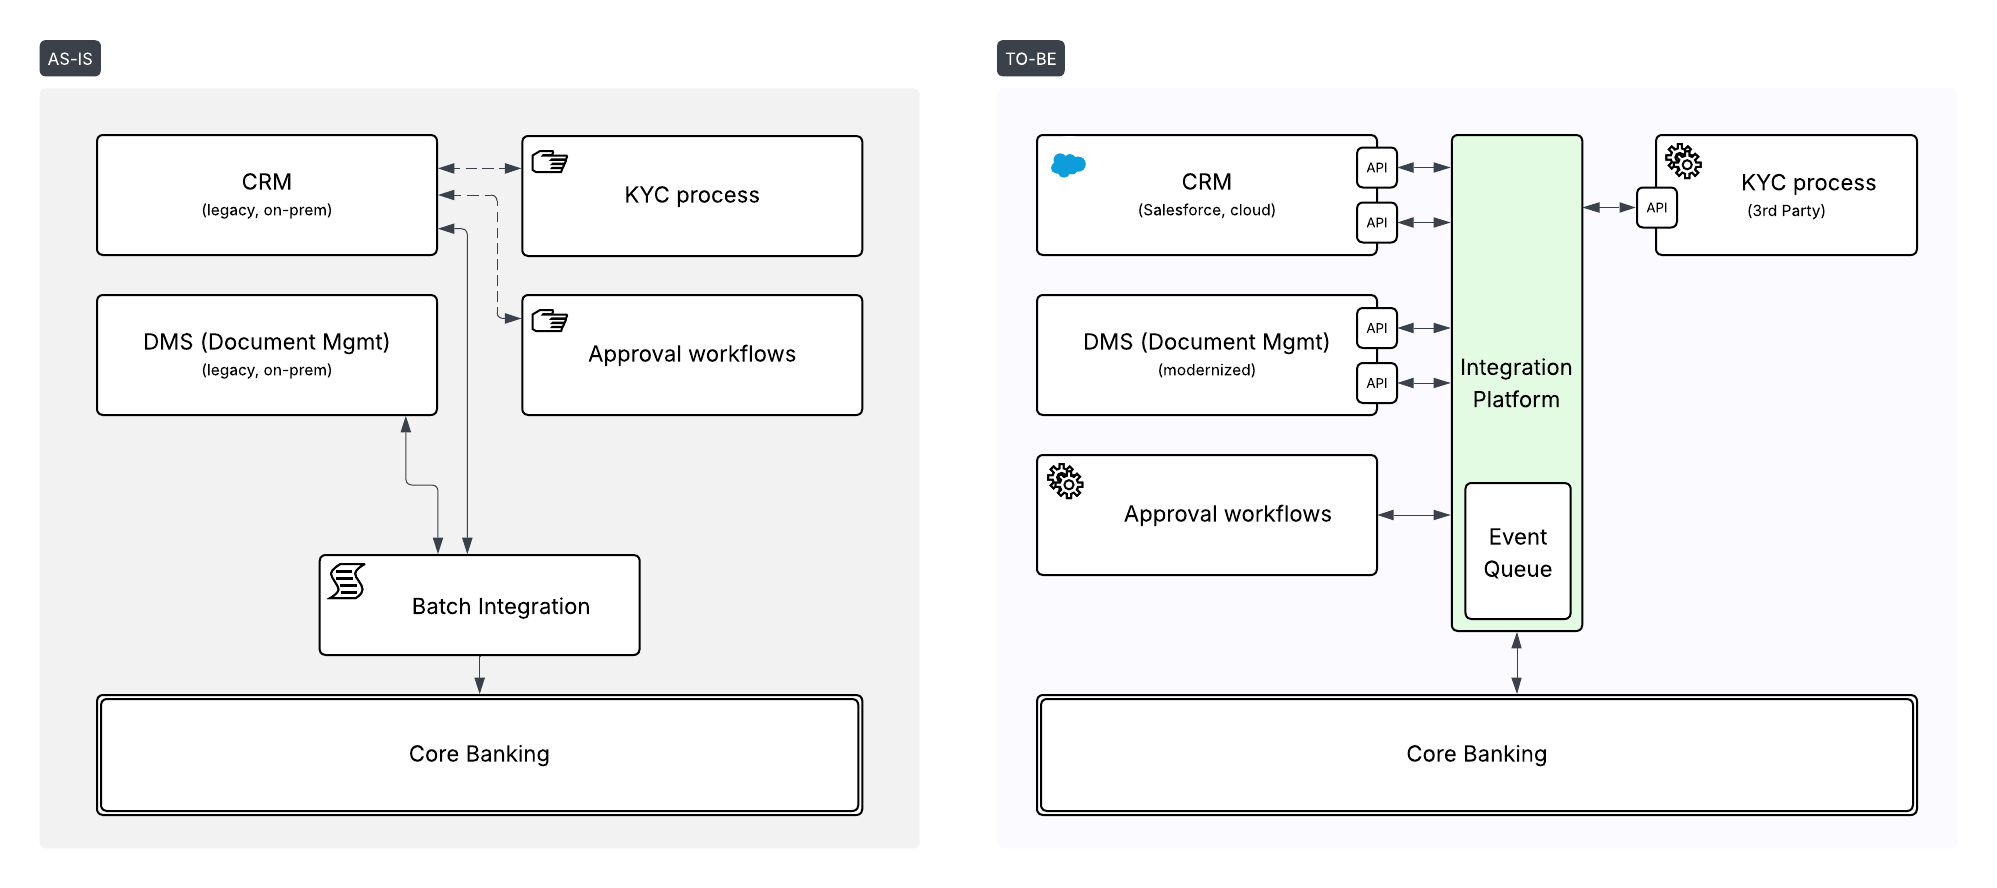
AS-IS → TO-BE architecture diagram drawn by a human pre-sales engineer.
Experiments
Now that we have our test cases - let’s run a series of experiments using different possible methods to generate a diagram.
1. Using image generation model
Let’s starting with the simplest method. There is a number of image generation models, that excel in generating funny animal images and flying cars, but can they generate technical solution diagrams? Let’s see.
Note: if you want to see the prompts that were used - I have included them in the Appendix at the end of the article.
DALL-E (Legacy)
I decided to start with DALL-E to show how image generation looked like still a few months ago. I did not have a lot of hope for this one, and as you can see yourself - DALL-E returned a vibrant hallucination, but nothing really close to what we want:
Enterprise WAN diagram generated by legacy DALL-E model
AS-IS → TO-BE systems architecture diagram generated by legacy DALL-E model
Flux.2 [Pro]
That was just a warm-up. Let’s try with some newer models. Flux.2 is one of the premium models capable of generating high-quality photorealistic images. Let’s see how it deals with infographics / diagrams?
Enterprise WAN diagram generated by Flux.2 Pro model
AS-IS → TO-BE systems architecture diagram generated by Flux.2 Pro model
Not bad as an infographic, but not very close to a real technical diagram that we’d like to get. Also - easily you can spot flaws of image generation models - broken characters, artifacts, random arrows, icons. We need to be careful.
ChatGPT 5.1 (Pro)
I tried the same with the image generation model built into the recent ChatGPT 5.1. It seems to be prone to similar flaws…
Enterprise WAN diagram generated by ChatGPT (5.1, Thinking mode)
AS-IS → TO-BE systems architecture diagram generated by ChatGPT (5.1, Thinking mode)
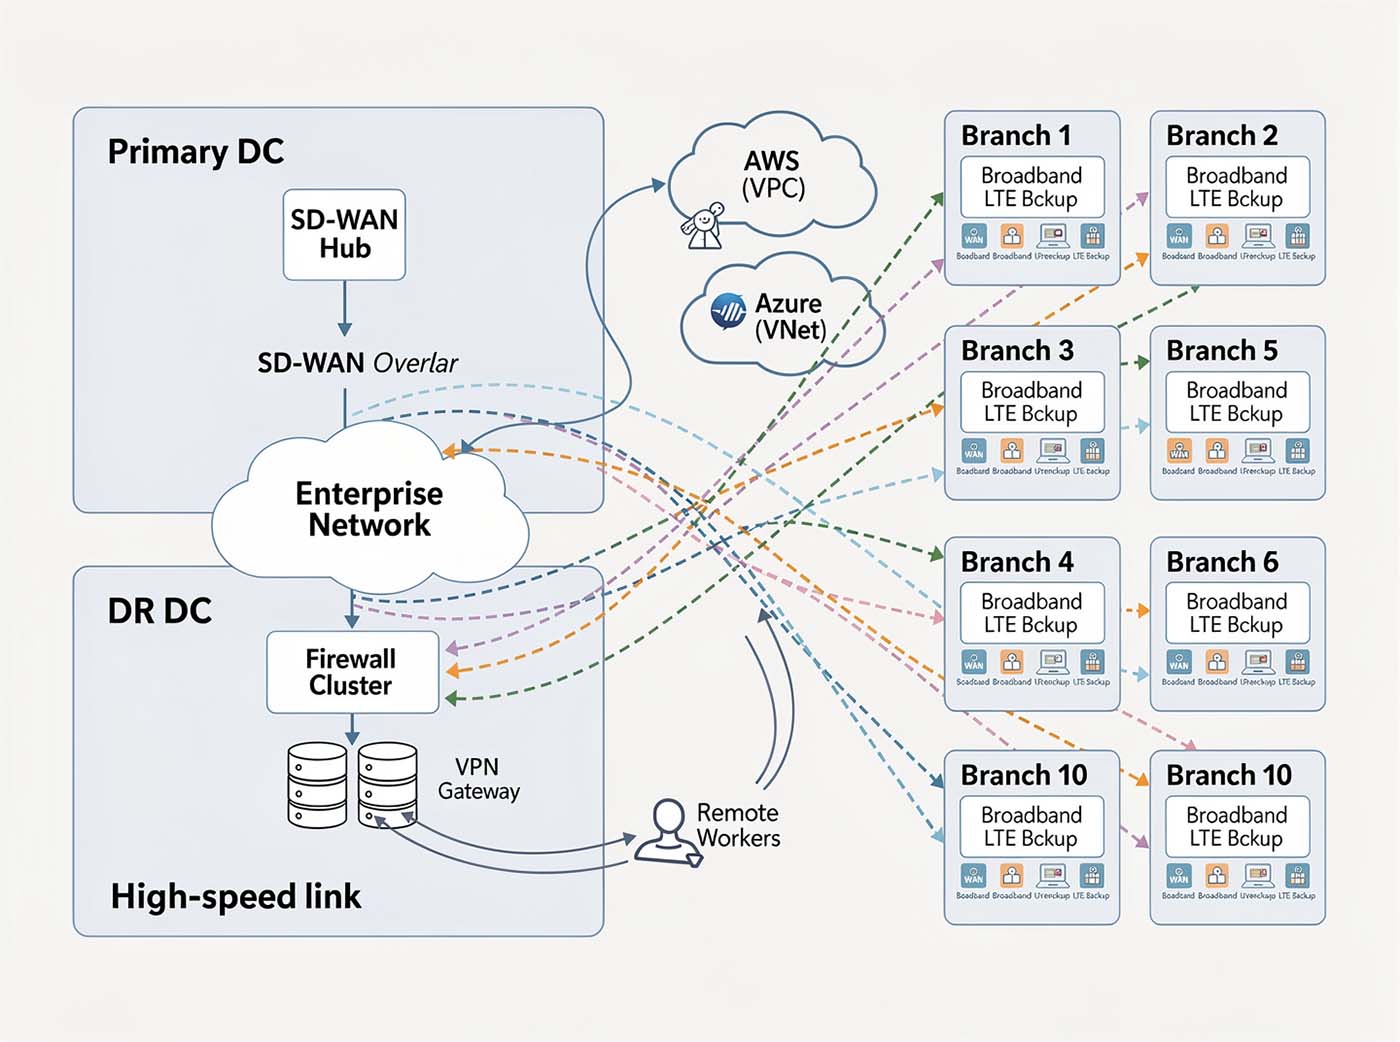
Gemini Nano Banana (Pro)
Finally - let’s try with a recent hero in the image generation space - Gemini Nano Banana. We can definitely see pictures that are closer to what a technical diagram should look like. And Nano Banana seems to handle text characters pretty well. But if you look closely - there are a few inconsistencies and errors in the diagram itself (e.g. “Enterprise Network” was placed in Disaster Recovery DC group).
Enterprise WAN diagram generated by Gemini Nano Banana (Pro, Thinking mode)
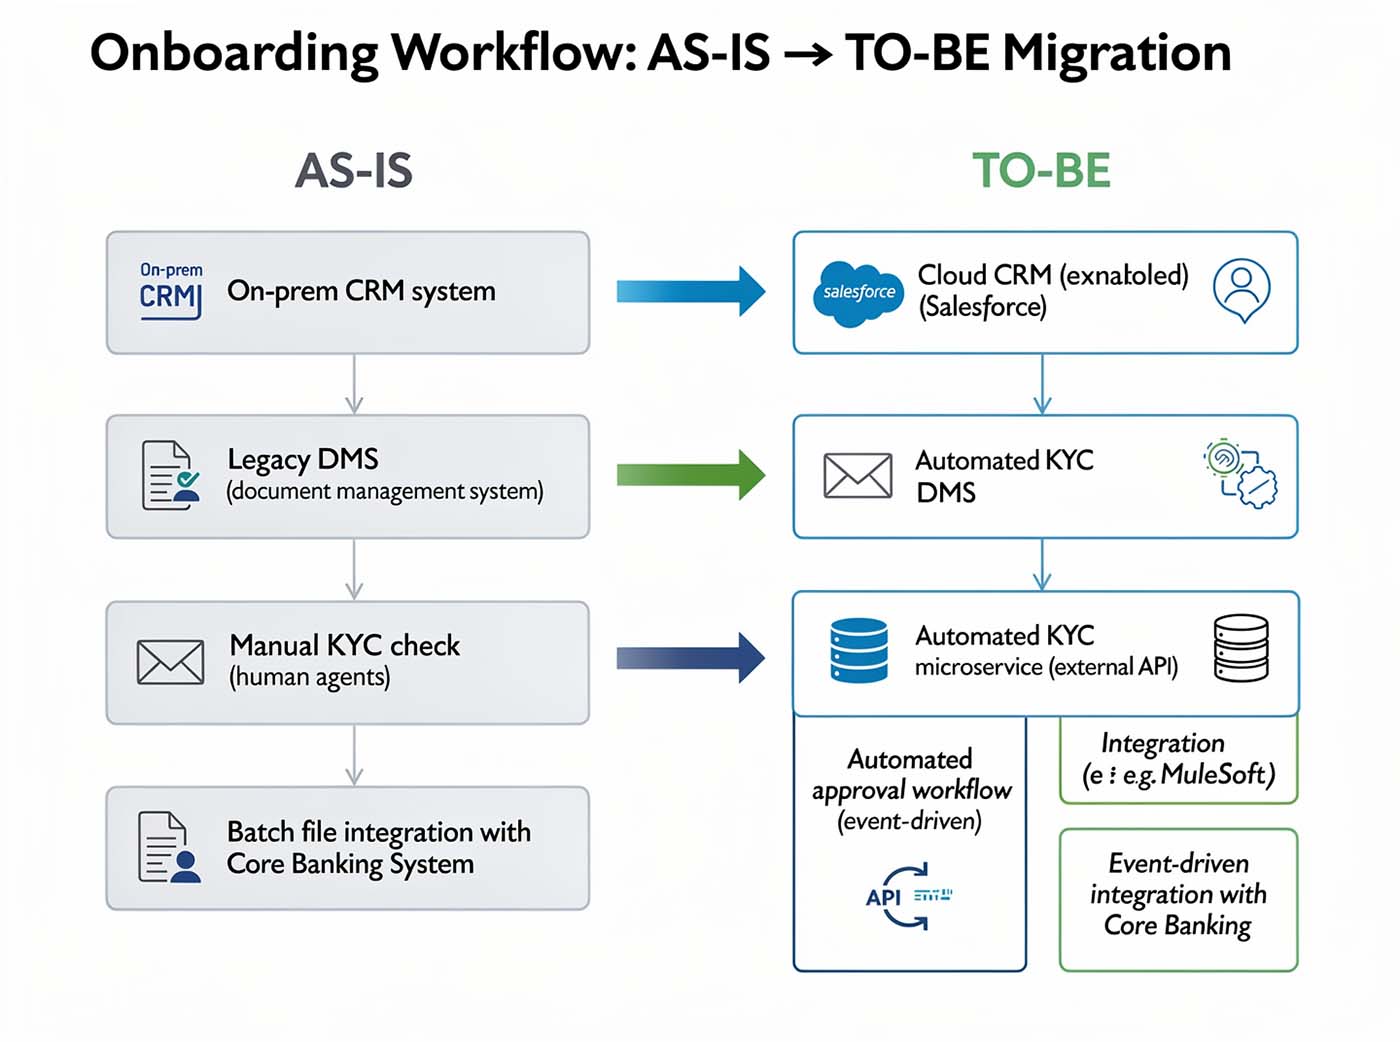
AS-IS → TO-BE systems architecture diagram generated by Gemini Nano Banana (Pro, Thinking mode)
My verdict
At the current stage - image generation models probably could generate infographics with an acceptable quality, but they can’t really produce a diagram that would be technically correct and usable as a - for example - solution diagram attached to the customer solution proposal.
2. Using LLM to generate syntax
We’ve just proven that LLMs can be very creative when it comes to drawing pixels. But the creativity component in our case is rather unwanted. We’re looking for something consistent and reliable. So let’s try a different approach.
Pixels is just one way to represent diagrams that we’re trying to draw. But they can also be represented in a different way than as an image.
This approach is called “diagram-as-a-code” and there are open-source libraries that introduce a structured syntax that is later rendered into a diagram. Some examples to mention are Mermaid.js, d2lang, PlantUML or Graphviz.
So let’s see whether LLMs can actually deal with generating a diagram syntax
AI-generation built-into Mermaid
Mermaid is a pretty interesting open source library with a set of supported diagram types (process diagrams, architecture diagrams, network diagrams, etc.). I have signed up for a free trial in their Pro version and tried to generate diagrams using their built in AI-to-diagram feature, but in both cases it failed to work.
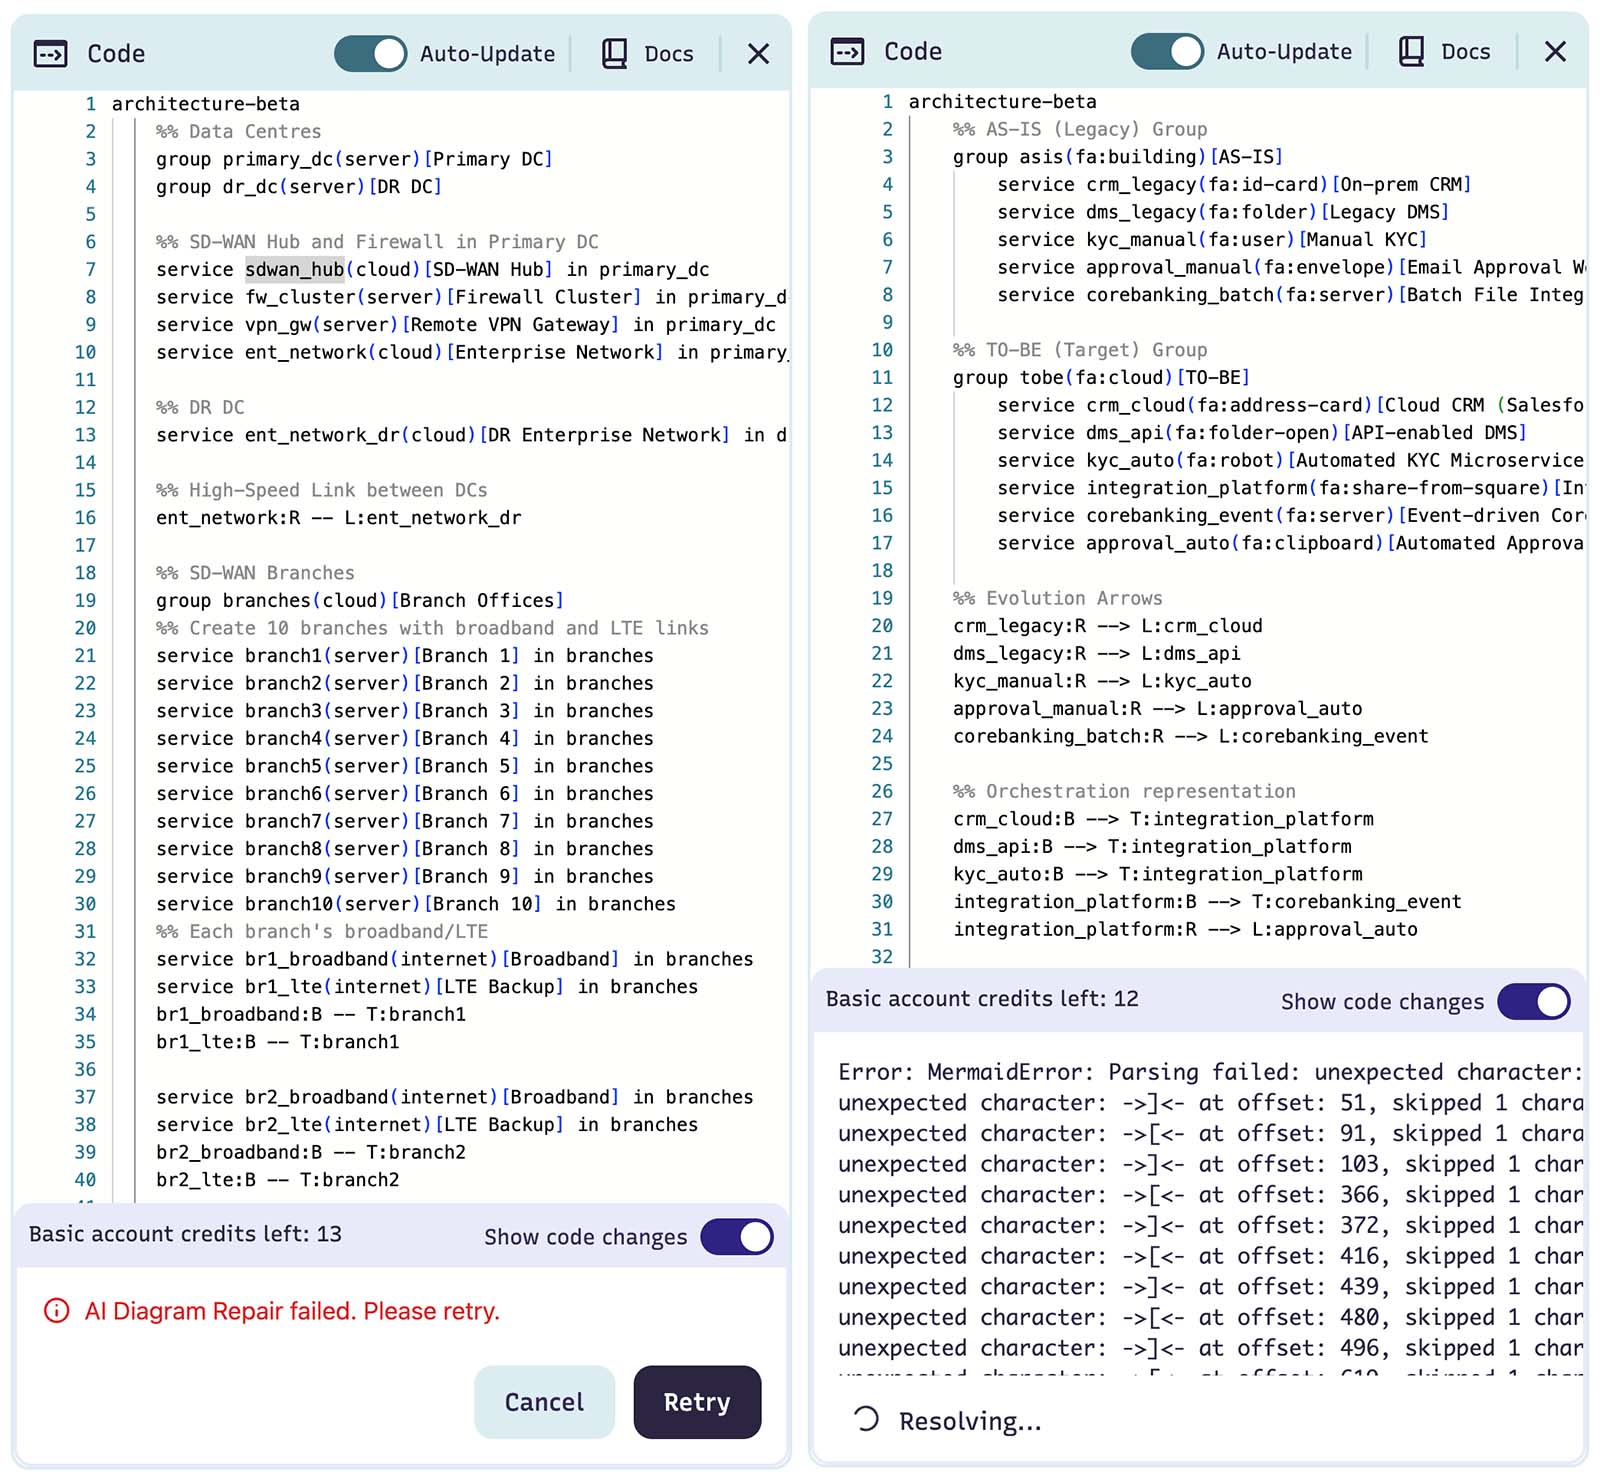
Attempts to generate diagrams with Mermaid built-in AI-to-diagram feature
Mermaid syntax generated with ChatGPT 5.1
However as mermaid syntax is open source - we can use other LLMs to generate it. Here is ChatGPT version (note: before getting a working diagram - I had to ask ChatGPT a few times to fix the syntax due to parsing errors).
Enterprise WAN diagram with mermaid.js syntax generated by ChatGPT 5.1 (Thinking mode), rendered by mermaid.live editor.
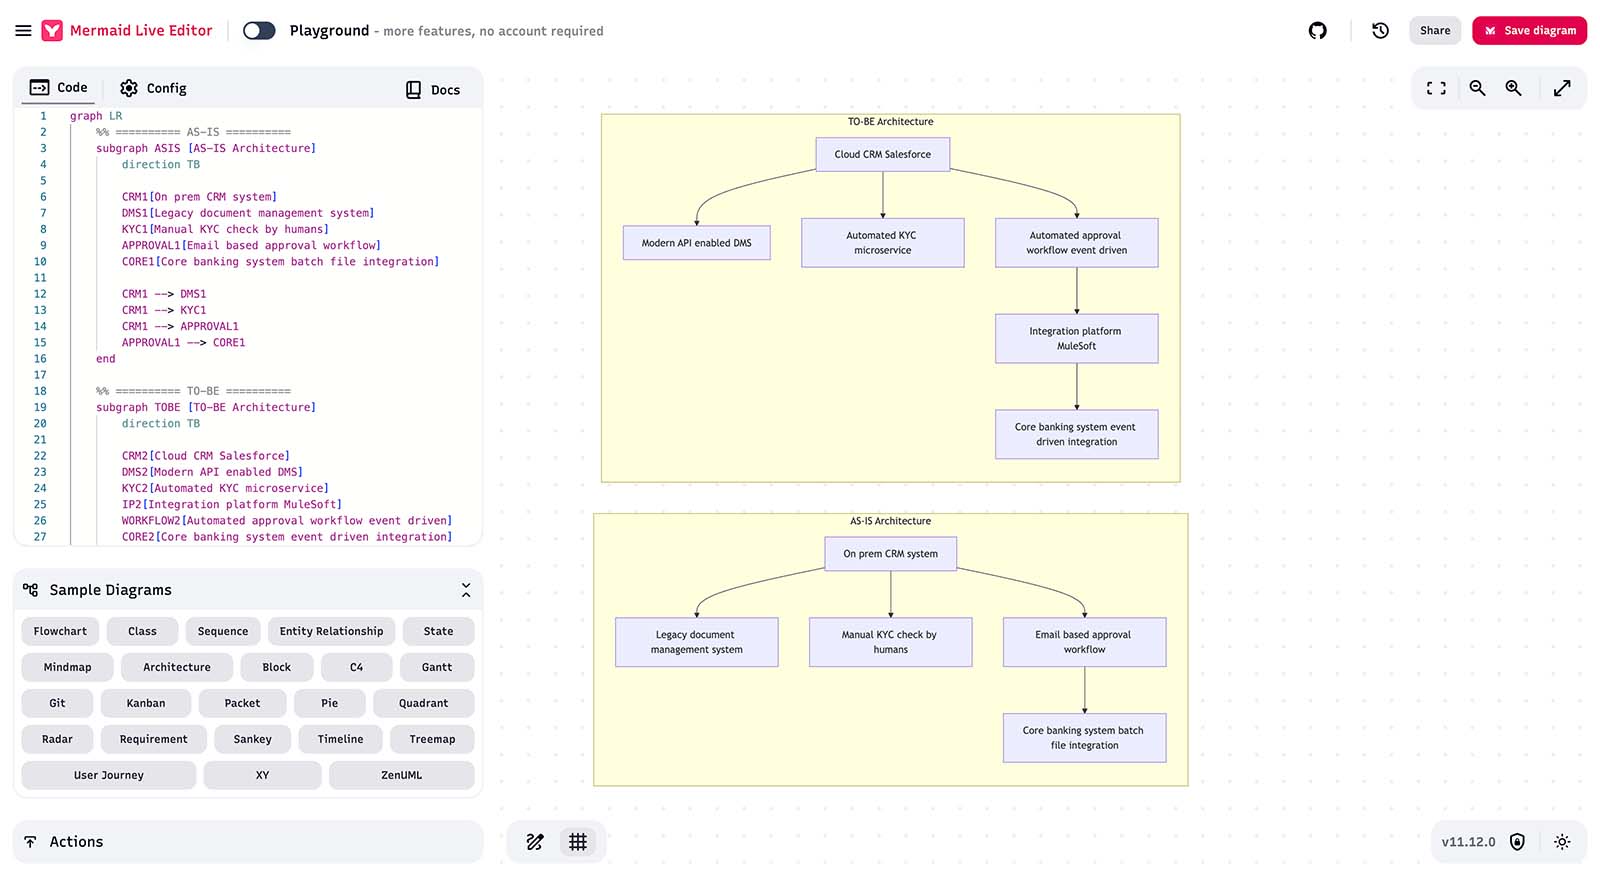
AS-IS → TO-BE systems architecture diagram with mermaid.js syntax generated by ChatGPT 5.1 (Thinking mode), rendered by mermaid.live editor.
Mermaid syntax generated with Claude Sonnet 4.5
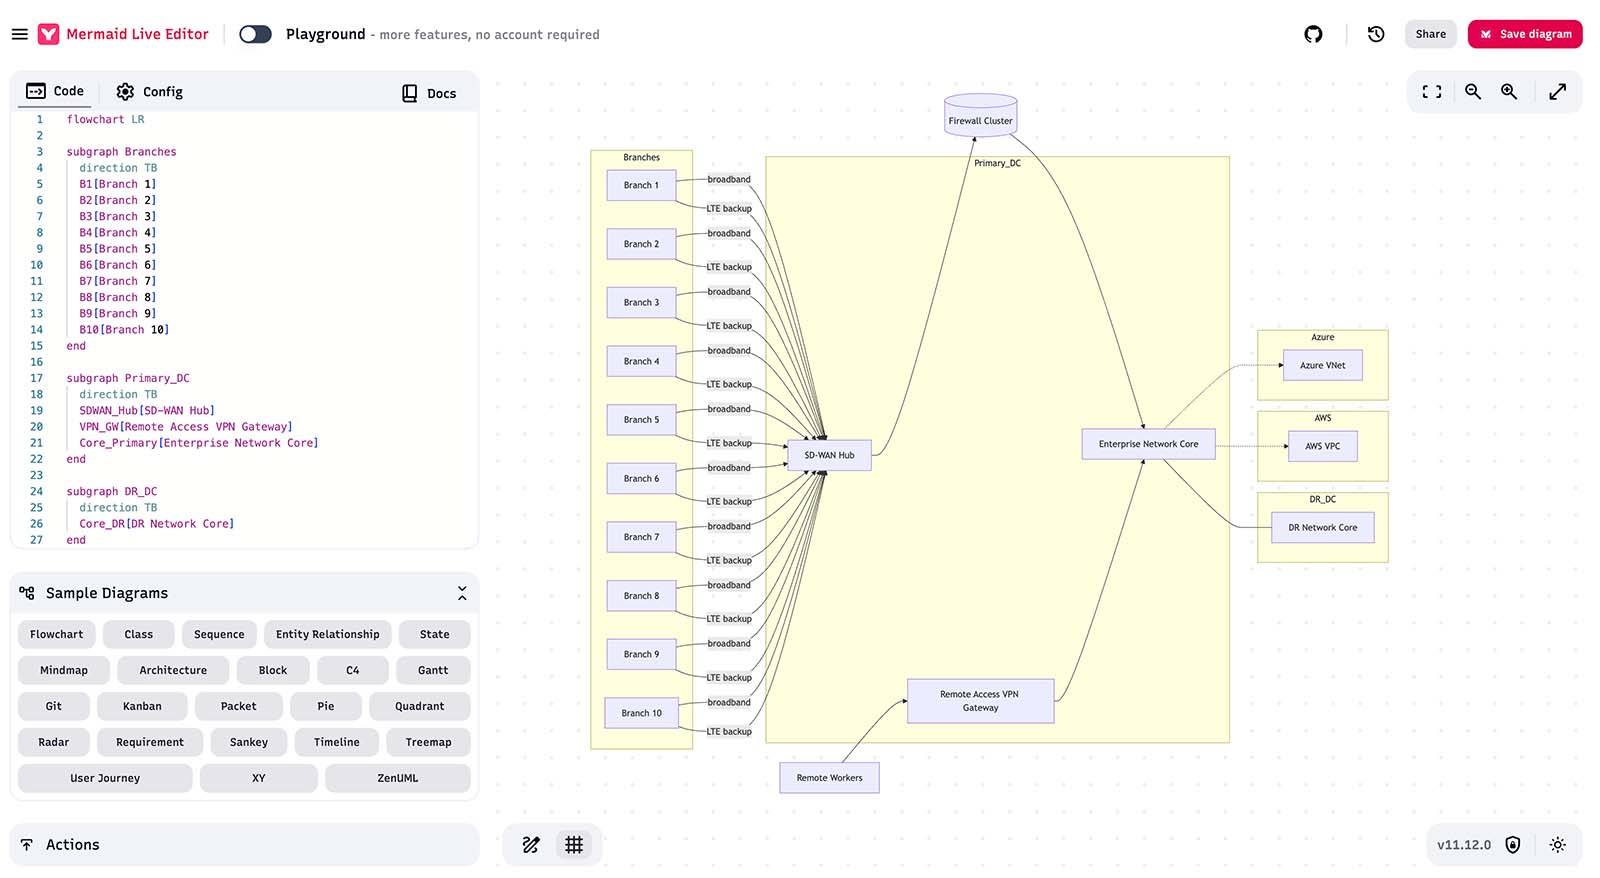
And just to compare - this is Claude Sonnet 4.5 version. (note: Claude generated syntax worked fine).
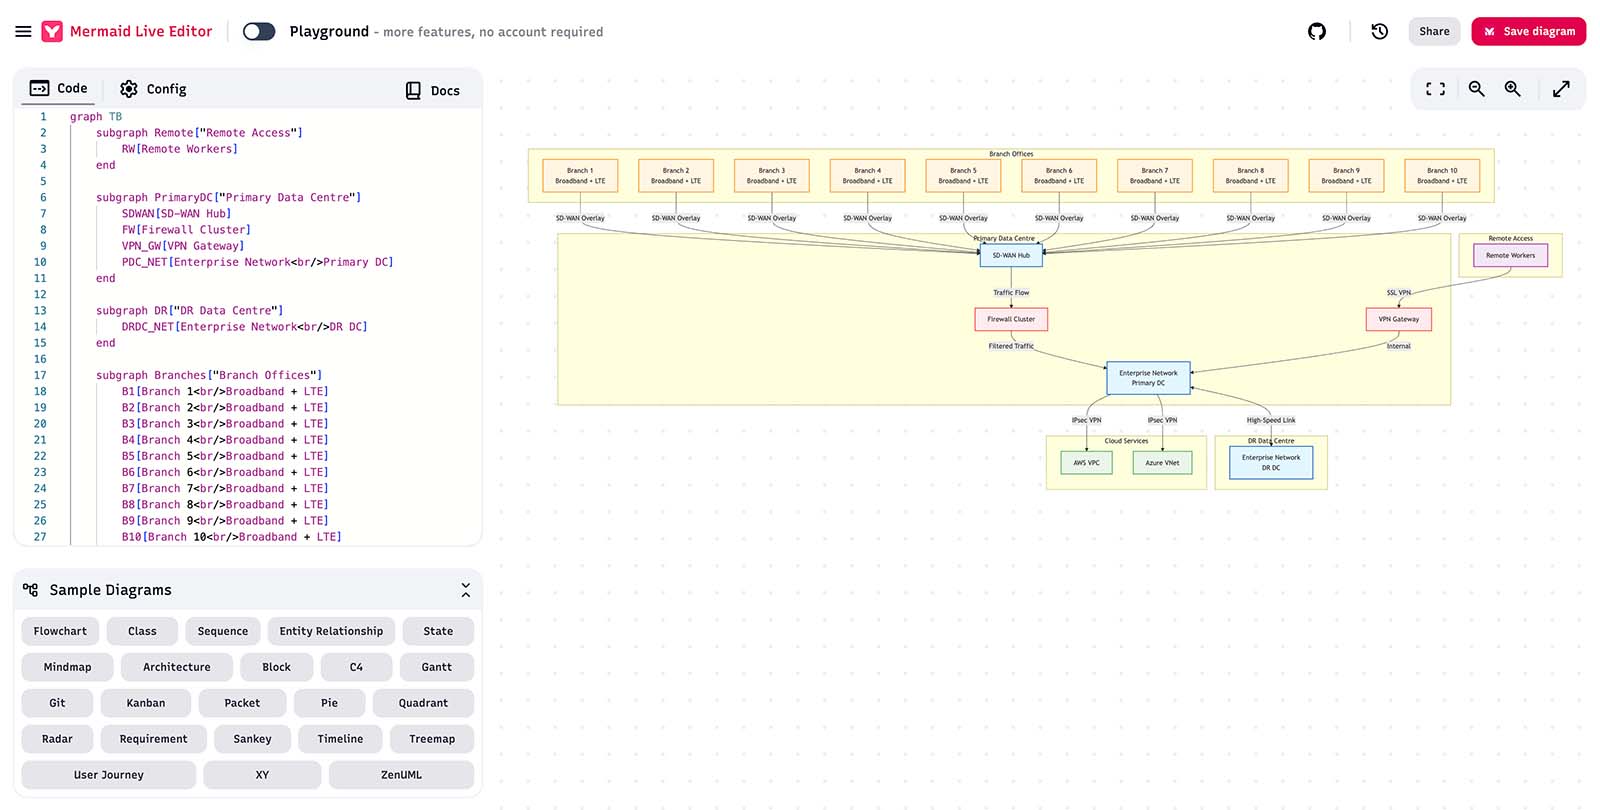
Enterprise WAN diagram with mermaid.js syntax generated by Claude Sonnet 4.5 (Thinking mode), rendered by mermaid.live editor.
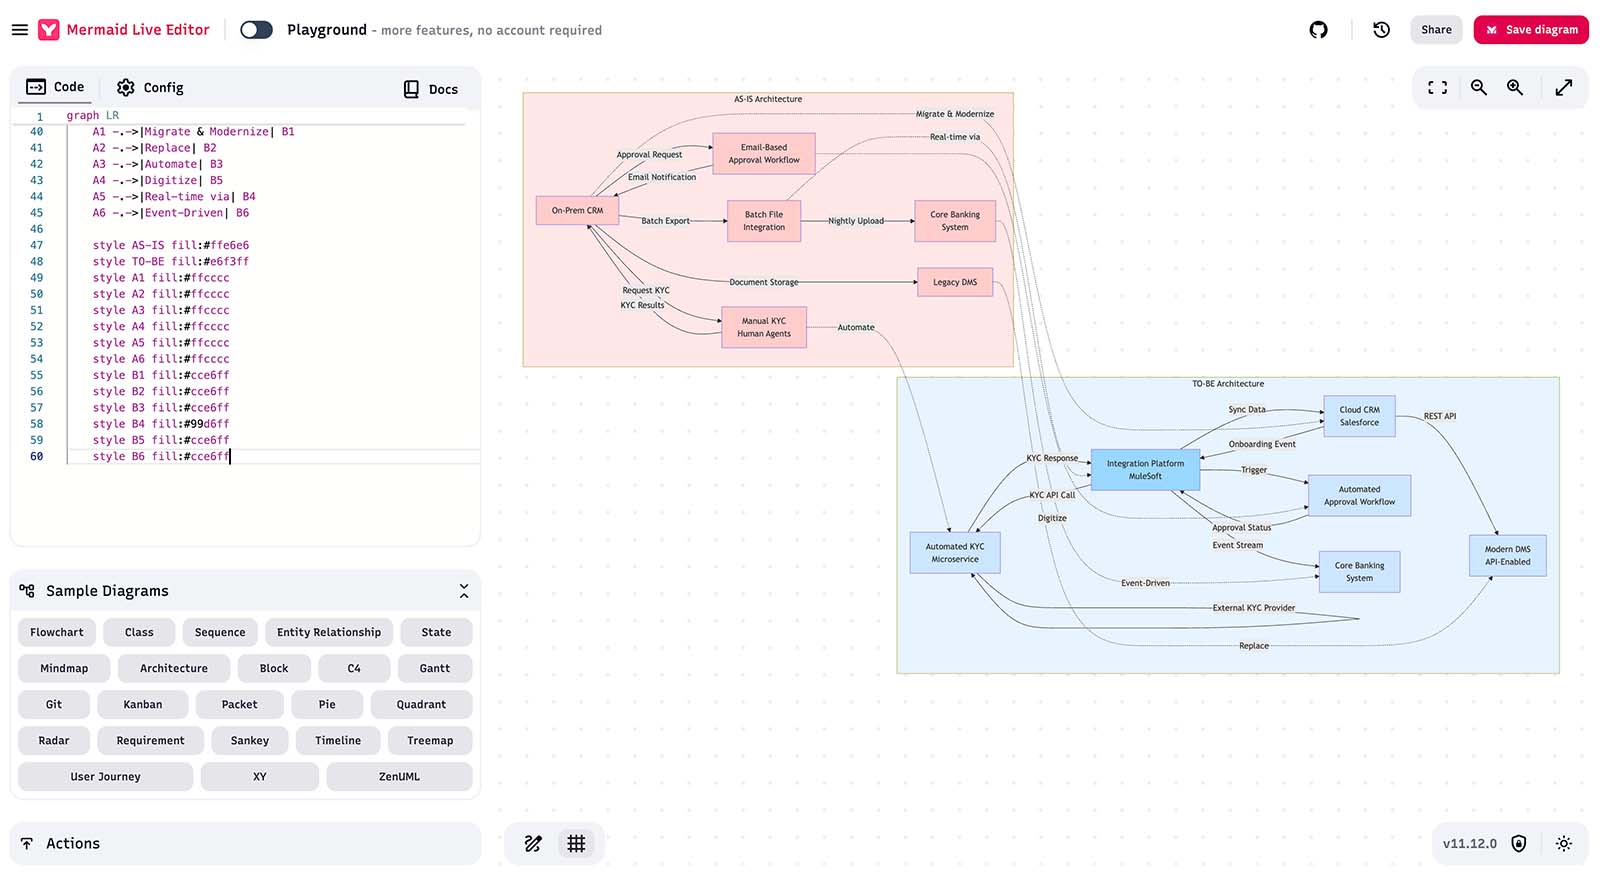
AS-IS → TO-BE systems architecture diagram with mermaid.js syntax generated by Claude Sonnet 4.5 (Thinking mode), rendered by mermaid.live editor.
One think to point out here - although diagrams generated by Claude do not look pretty, from the correctness / structure point of view - they are quite correct. So perhaps it’s just the case of rendering engine
EraserAI
Eraser is another commercial tool in the diagramming space (apparently built on top of some fork of d2lang syntax - another lexical way to represent diagrams, however compared to mermaid.js it seems to be rather closed source).
Here are diagrams generated with a built-in Eraser AI-to-diagram feature:
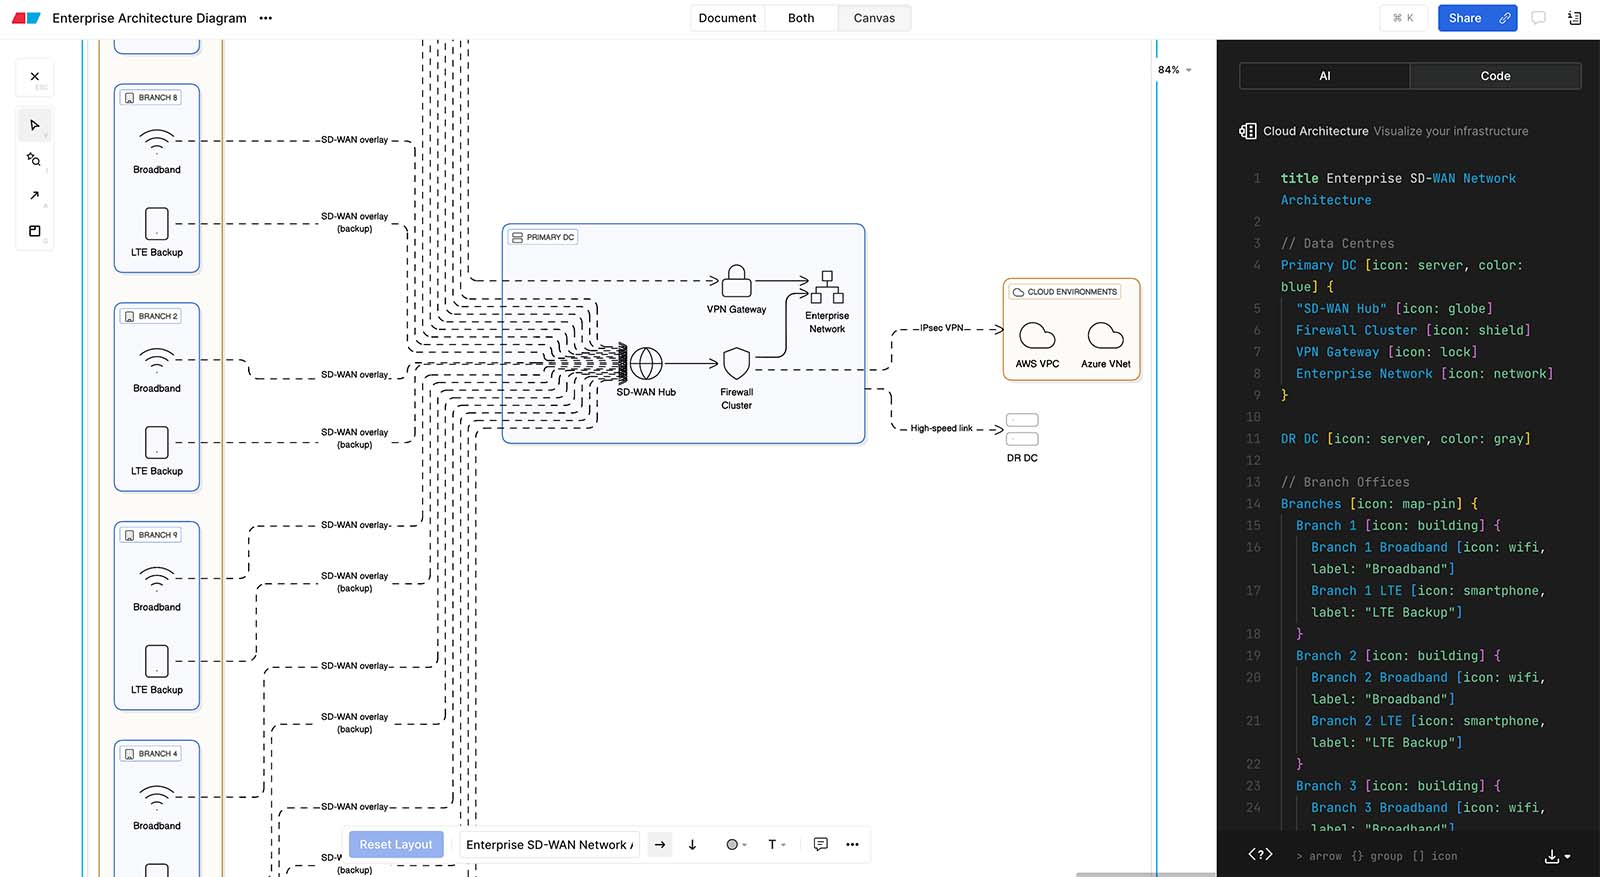
Enterprise WAN diagram with d2lang syntax generated by built-in Eraser AI-to-Diagram feature.
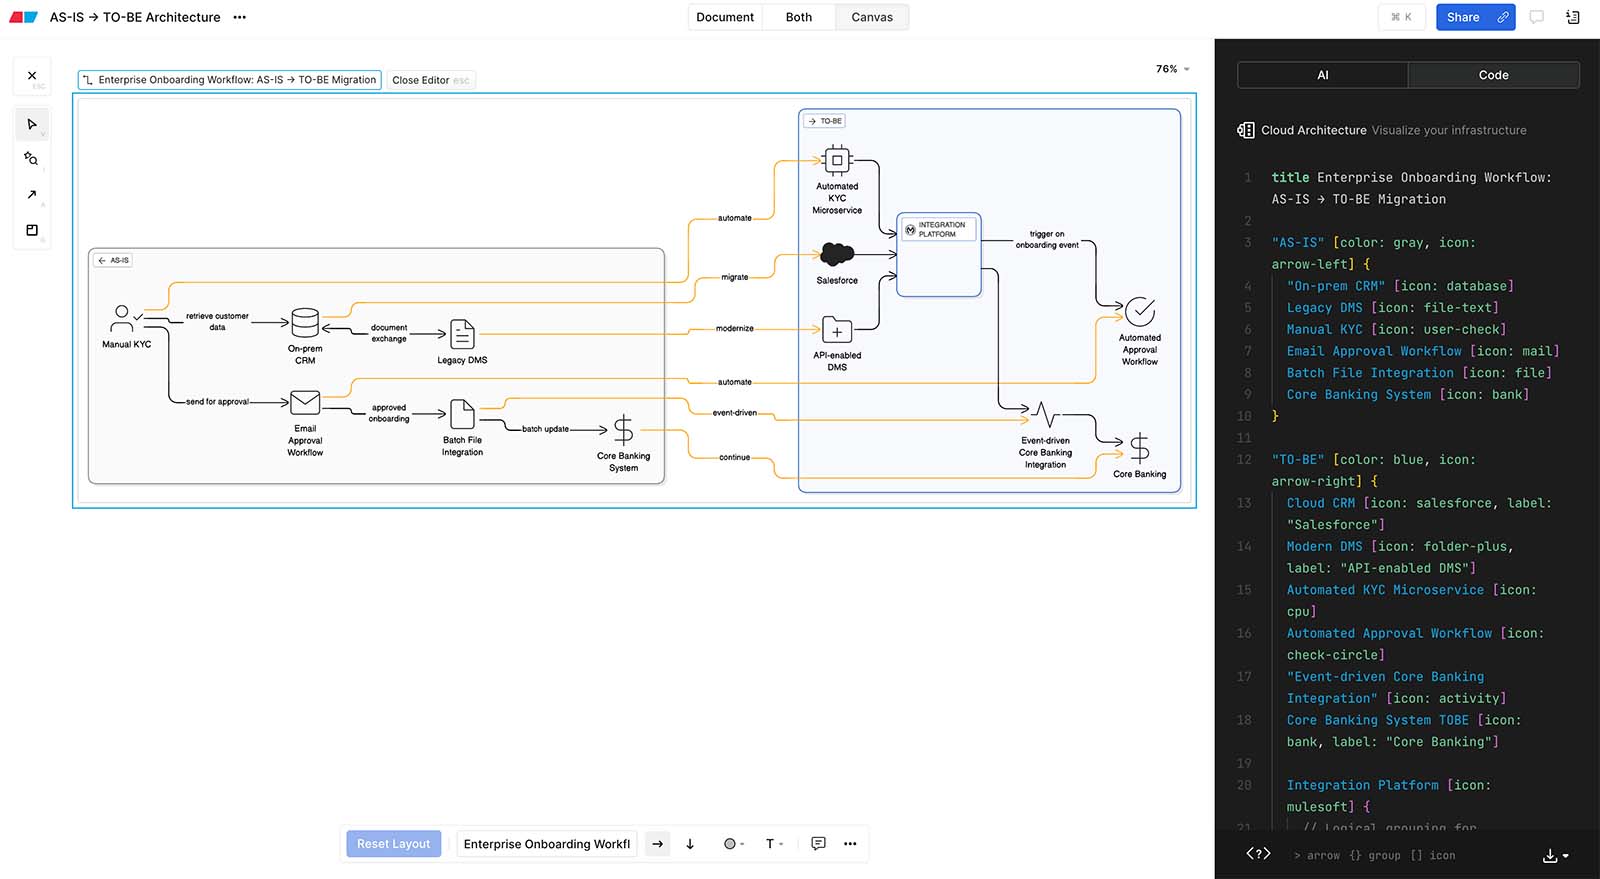
AS-IS → TO-BE systems architecture diagram with d2lang syntax generated by built-in Eraser AI-to-Diagram feature.
One thing to point here - as the approach to generate syntax is quite similar to Mermaid, we’re getting comparable results, but Eraser as a commercial tool seem to have a prettier rendering engine - diagrams look significantly better. And what is quite good - if I don’t like the result - I can make manual edits (with simple drag’n’drop just like in any other diagraming software).
My verdict
Although diagrams generated by this method are probably not yet very elegant and frequently prone to messy layout - they are not far away from being structurally correct and perhaps with the evolution of syntax (supported diagram types) as well as evolution of rendering engines - this approach might be quite promising.
3. Using (potentially specialised, fine-tuned) LLM to generate vector
Tools like Mermaid or Eraser (d2lang) leverage structured syntax to generate diagrams - therefore the look and feel of the diagram is controlled by the “rendering” engine.
But diagrams that we draw in tools like Visio, draw.io or Lucidchart - they are vector graphic. So the third method to try would be LLMs generating vectors.
For now I’m not familiar with any other way to generate vectors - other than using built-in AI into those tools. So for the purpose of our experiment I have tried two tools that attempt to follow that approach.
Lucidchart (OpenAI through AWS Azure)
Let’s see the first one - a built-in Lucidchart AI-to-diagram feature.
Enterprise WAN diagram generated by Lucidchart built-in AI-to-diagram feature
AS-IS → TO-BE systems architecture diagram generated by Lucidchart built-in AI-to-diagram feature
Miro
Miro.com is more for collaborative whiteboarding, but recently it launched “sidekicks” - it’s AI drawing assistant.e
Enterprise WAN diagram generated by Miro built-in AI-to-diagram feature

AS-IS → TO-BE systems architecture diagram generated by Miro built-in AI-to-diagram feature
My verdict
As you can see - the built-in AI-to-diagram performed a vibrant interpretation of the prompt, hence probably a lot of human re-work would be required before presenting that to the end customer.
Conclusions
I think we’ve proven that still there is no perfect solution that can replace human expert in creating structurally correct and at the same time clean, elegant diagram. But with some experiments outlined above - I believe that we can confidently say, that with proper tooling AI is capable to speed up that process significantly. Pretty much like in all the other spaces where we’re seeing real applications of AI serving as an assistant rather than replacement.
Bonus
I decided to try one more thing - using human-drawn diagrams as examples - trying to generate new diagrams (for a different test case) with Google Nano Banana model.
And I need to say - it did pretty well … 🤔

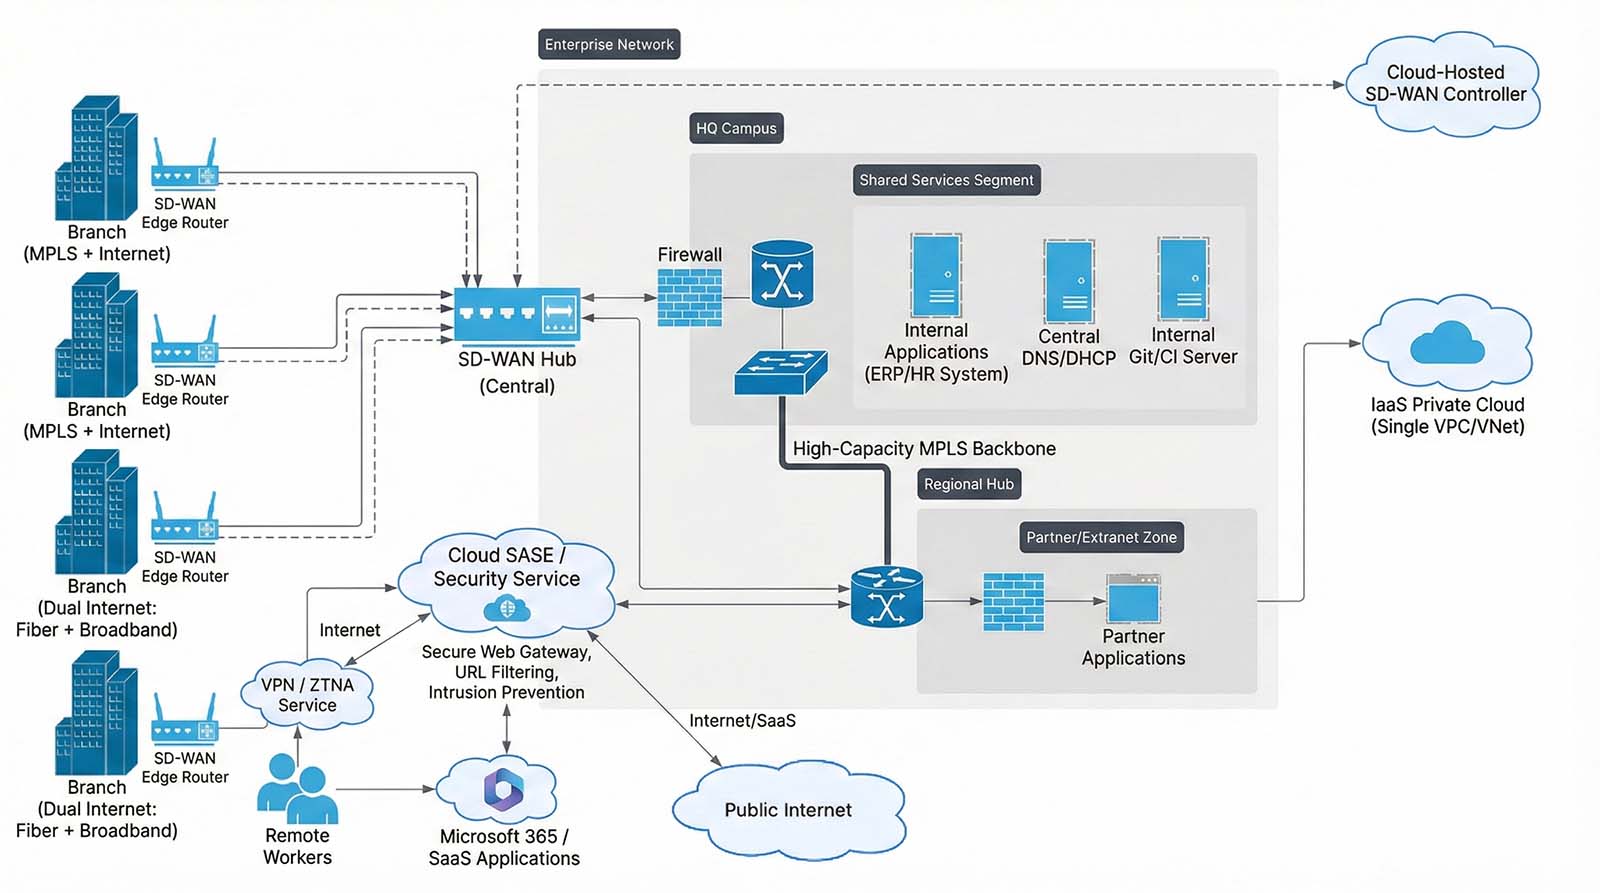
Enterprise WAN diagram generated by Google Nano Banana - with a prompt including sample diagram image as a reference for styling & layout (see Prompt #5)
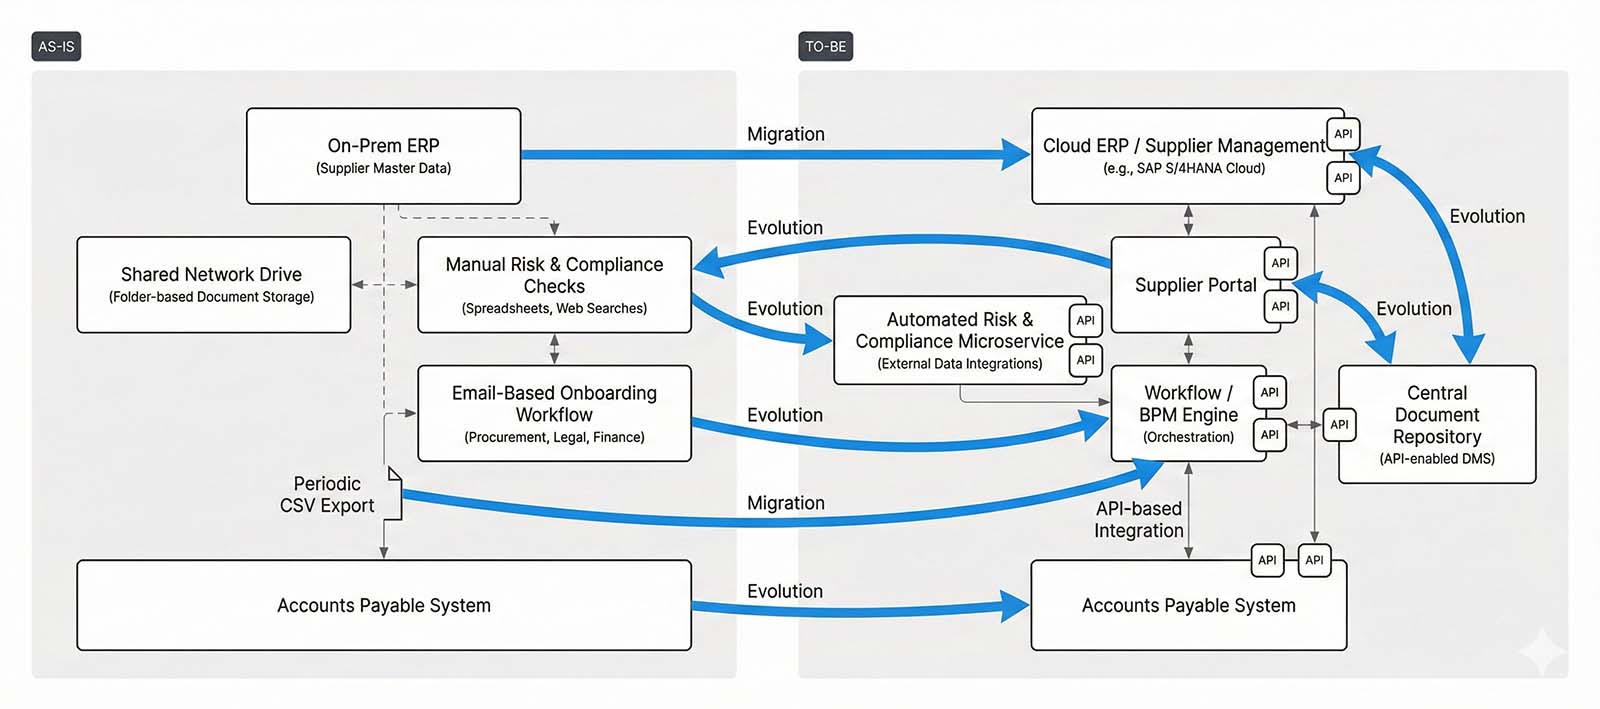
AS-IS → TO-BE systems architecture diagram generated by Google Nano Banana - with a prompt including sample diagram image as a reference for styling & layout (see Prompt #6)
Appendix - Prompts
For reference, below I’m including prompts that I have used to run above experiments.
Prompt #1
Network Diagram for Experiment 1 (Image Generation Model)
Create an image with a network architecture diagram that includes the following components:
– Two enterprise data centres: "Primary DC" and "DR DC", interconnected with a high-speed link.
– A central SD-WAN hub located in the Primary DC.
– Ten branch offices connected via SD-WAN overlay tunnels to the SD-WAN hub.
– Each branch has two WAN uplinks: broadband + LTE backup.
– A central firewall cluster between the SD-WAN hub and the enterprise network.
– IPsec VPN tunnels from the enterprise network to AWS (VPC) and Azure (VNet).
– Remote workers connect via a VPN gateway positioned in the Primary DC.
Represent data flows logically (e.g., branches → SD-WAN hub → firewall → DC or cloud). Do not include vendor-specific icons unless necessary.
Prompt #2
AS-IS → TO-BE Architecture Diagram for Experiment 1 (Image Generation Model)
Create an image with a two-phase systems architecture diagram showing AS-IS → TO-BE migration for an enterprise onboarding workflow.
AS-IS architecture:
– On-prem CRM system
– Legacy document management system (DMS)
– Manual KYC check performed by human agents
– Email-based approval workflow
– Batch file integration with the Core Banking System
TO-BE architecture:
– Cloud CRM (Salesforce)
– Modern API-enabled DMS
– Automated KYC microservice using external API
– Integration Platform (e.g. MuleSoft) orchestrating system-to-system flows
– Event-driven integration with Core Banking
– Automated approval workflow triggered by onboarding events
Layout requirement:
– Show AS-IS on the left, TO-BE on the right
– Use clear arrows to show how each AS-IS component evolves or is replaced
– Represent logical interactions, not infrastructure topology
Prompt #3
Network Diagram for Experiment 1 (Image Generation Model)
Same as Prompt #1 - just beginning with “Create a mermaid.js syntax for a network architecture diagram …”
Prompt #4
AS-IS → TO-BE Architecture Diagram for Experiment 2 (Syntax Generation)
Same as Prompt #2 - just beginning with “Create a mermaid.js syntax for a two-phase systems architecture […] (can be two separate diagrams if better) …”
Prompt #5
Network Diagram for Bonus Experiment
Create an image with a network architecture diagram that includes the following components:
– Two main corporate sites: "HQ Campus" and "Regional Hub", interconnected with a high-capacity MPLS backbone.
– A cloud-hosted SD-WAN controller managing all WAN edge devices.
– Eight branch offices connected to the WAN using SD-WAN edge routers.
– Half of the branches use MPLS + Internet as underlay.
– The other half use dual Internet links (fiber + broadband).
– Direct internet breakout at each branch, enforced through a cloud-delivered SASE / security service (secure web gateway, URL filtering, intrusion prevention).
– A shared services segment in the HQ Campus that hosts:
– Internal applications (ERP/HR system)
– Central DNS/DHCP
– Internal Git/CI server
– Connectivity from the enterprise network to:
– Microsoft 365 / SaaS applications (via SASE / internet)
– A private cloud environment running in an IaaS provider (single VPC/VNet).
– A partner/extranet zone located at the Regional Hub, segregated by a firewall, where selected branches and the HQ can access partner applications.
– Remote workers connecting via a cloud VPN / ZTNA service, which then routes traffic either to:
– Internal resources via SD-WAN fabric
– Internet/SaaS via the same SASE service.
Represent data flows logically (for example, branches → SD-WAN fabric → SASE / HQ / private cloud / partner zone). Do not include vendor-specific icons unless necessary.
You can use the attached image as a reference for styling / layout
Prompt #6
AS-IS → TO-BE Architecture Diagram for Bonus Experiment
Create an image with a two-phase systems architecture diagram showing AS-IS → TO-BE migration for a supplier onboarding workflow in a manufacturing company.
AS-IS architecture:
– On-prem ERP system handling supplier master data
– Shared network drive with folder-based storage for supplier documents (contracts, certificates)
– Manual vendor risk & compliance checks performed by procurement team (spreadsheets + web searches)
– Email-based onboarding workflow between Procurement, Legal, and Finance
– Periodic CSV file exports from ERP to the Accounts Payable system for vendor creation
TO-BE architecture:
– Cloud-based ERP / supplier management module (e.g. SAP S/4HANA Cloud or similar)
– Supplier Portal where vendors submit data and upload documents directly
– Automated risk & compliance scoring microservice integrating with external data providers (credit rating, sanctions lists)
– Workflow / BPM engine orchestrating onboarding steps across Procurement, Legal, and Finance
– API-based, near real-time integration between ERP and Accounts Payable system
– Central document repository with metadata and retention policies (API-enabled DMS)
Layout requirement:
– Show AS-IS on the left, TO-BE on the right
– Use clear arrows to show how each AS-IS component evolves or is replaced (e.g. shared drive → Supplier Portal + central DMS, manual checks → risk microservice, CSV export → API integration)
– Represent logical interactions, not infrastructure topology (focus on systems and flows, not servers or networks)
You can use the attached image as a reference for styling / layout